Dashboard
Dashboard is divided primarily into two parts
We'll first talk about Warehouse section and then see how the Alerted Chamber of it is presented.
Warehouse Section#
Warehouse Section is divided into 3 sections as shown in below image.
- Toggle Switch:This section can be used to toggle between the Dashboard view and device view. In device view, we can see the data of all the devices that are in your account without creating a warehouse.
- Warehouse:This section consist information of all the warehouse and chambers which are present in the account.
- Notifications: Any new alerts are displayed on the top-right of the bell icon. Click on this icon to view the alerts details.
Chamber Card#
The chamber card contains the name of the chamber, temperature and humidity configuration settings at the top. It also contains the device Id, last updated time and last logged temperature, humidity and battery status.
Viewing Device Data#
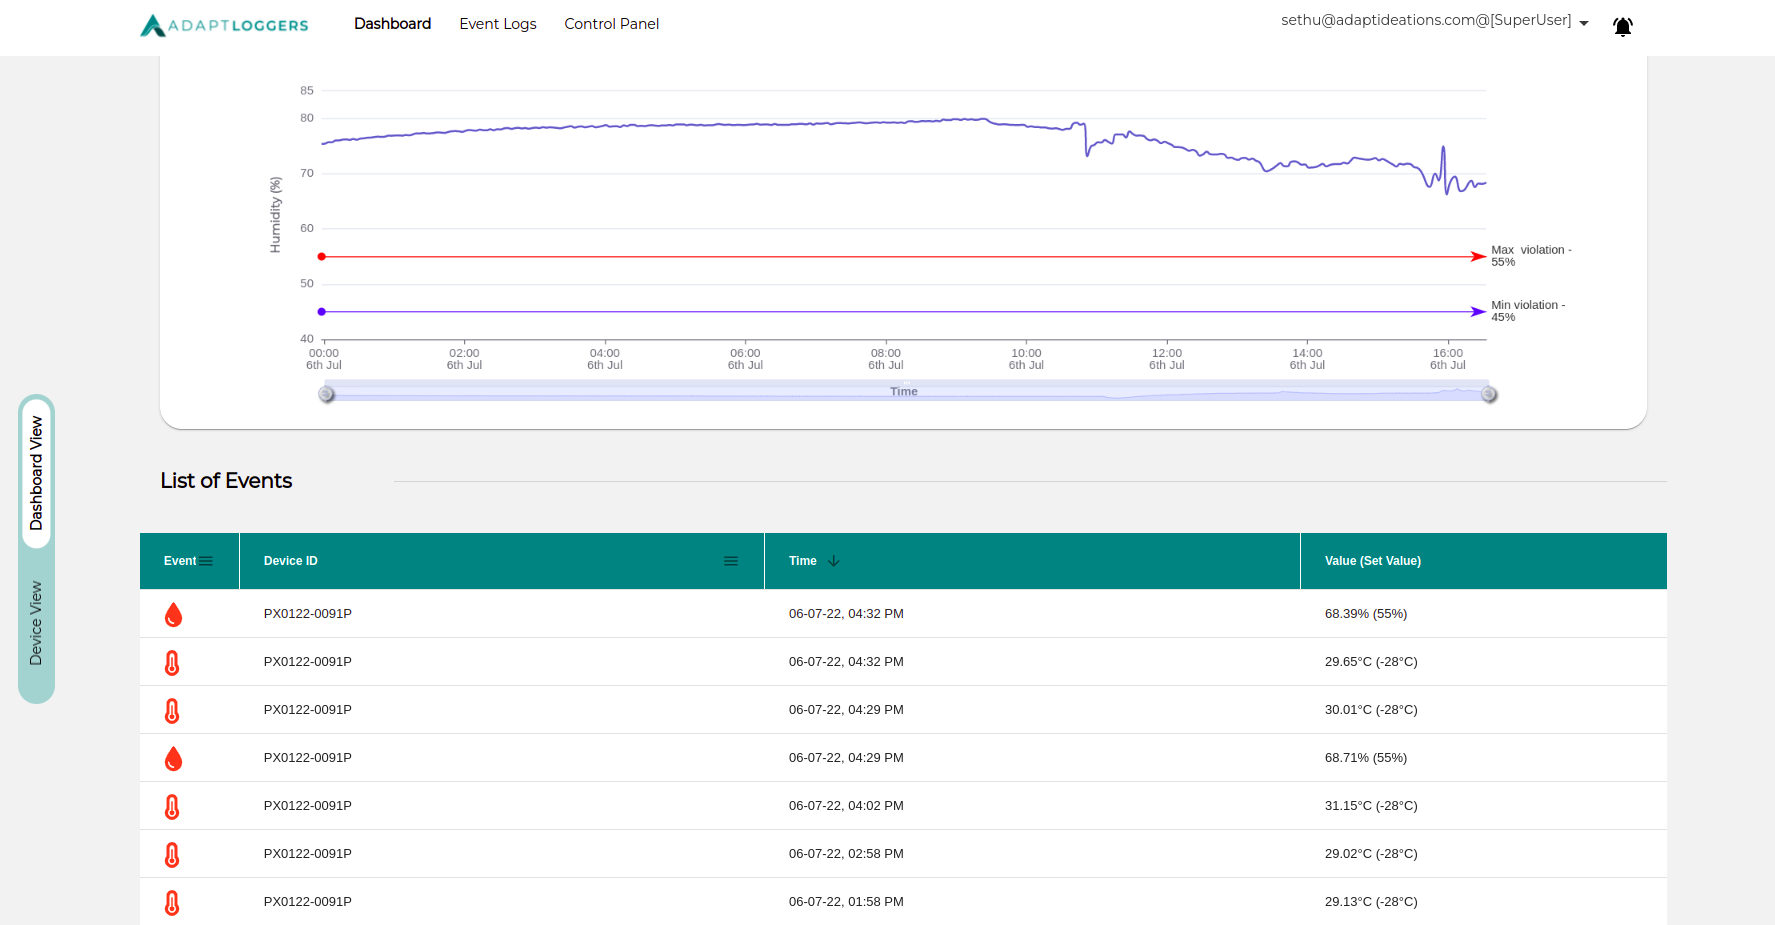
To view the detail of device belonging to particualar chamber , click on the card you wish to see the data of. You will see the temperature and humidity graph of the devices which are present in that selected card/chamber.
To view events of the selected card/chamber , scroll down the page, at the bottom of the screen you would see all the events of the devices which are present in the selected card.
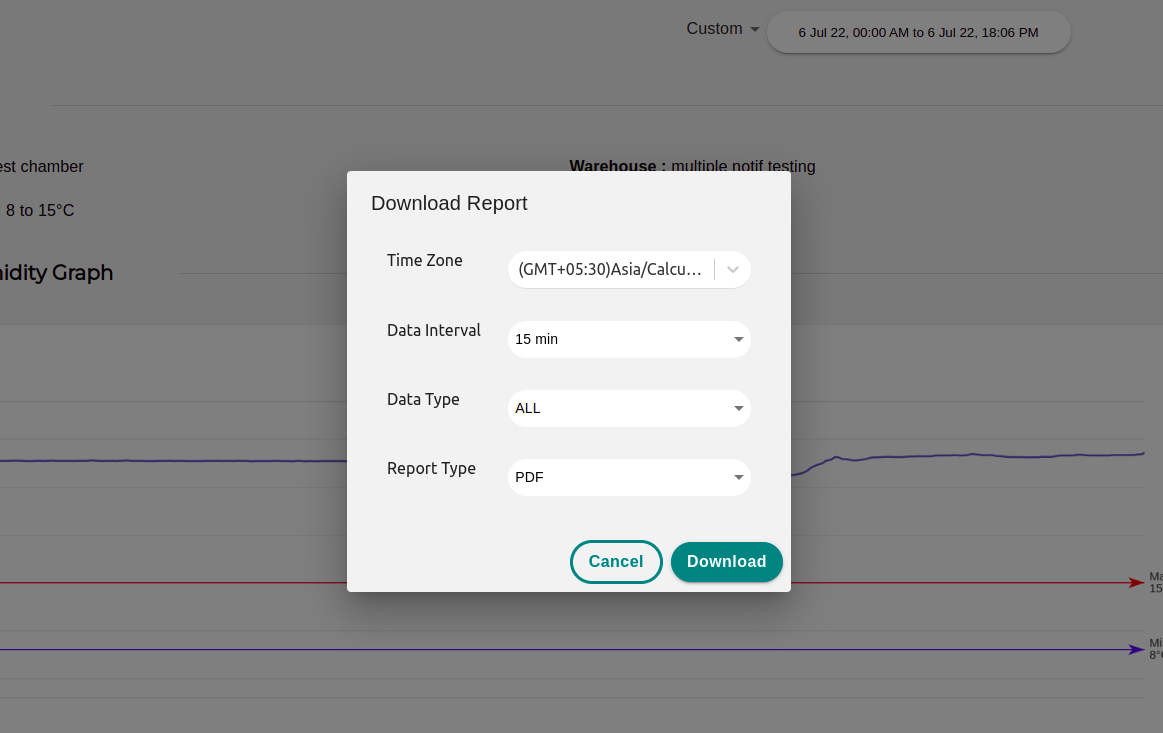
Report Download#
To download the report of any particular chamber, Click on the Report button , Mention the time zone, data interval, data type and report type.
Click on the Download button to download the report.
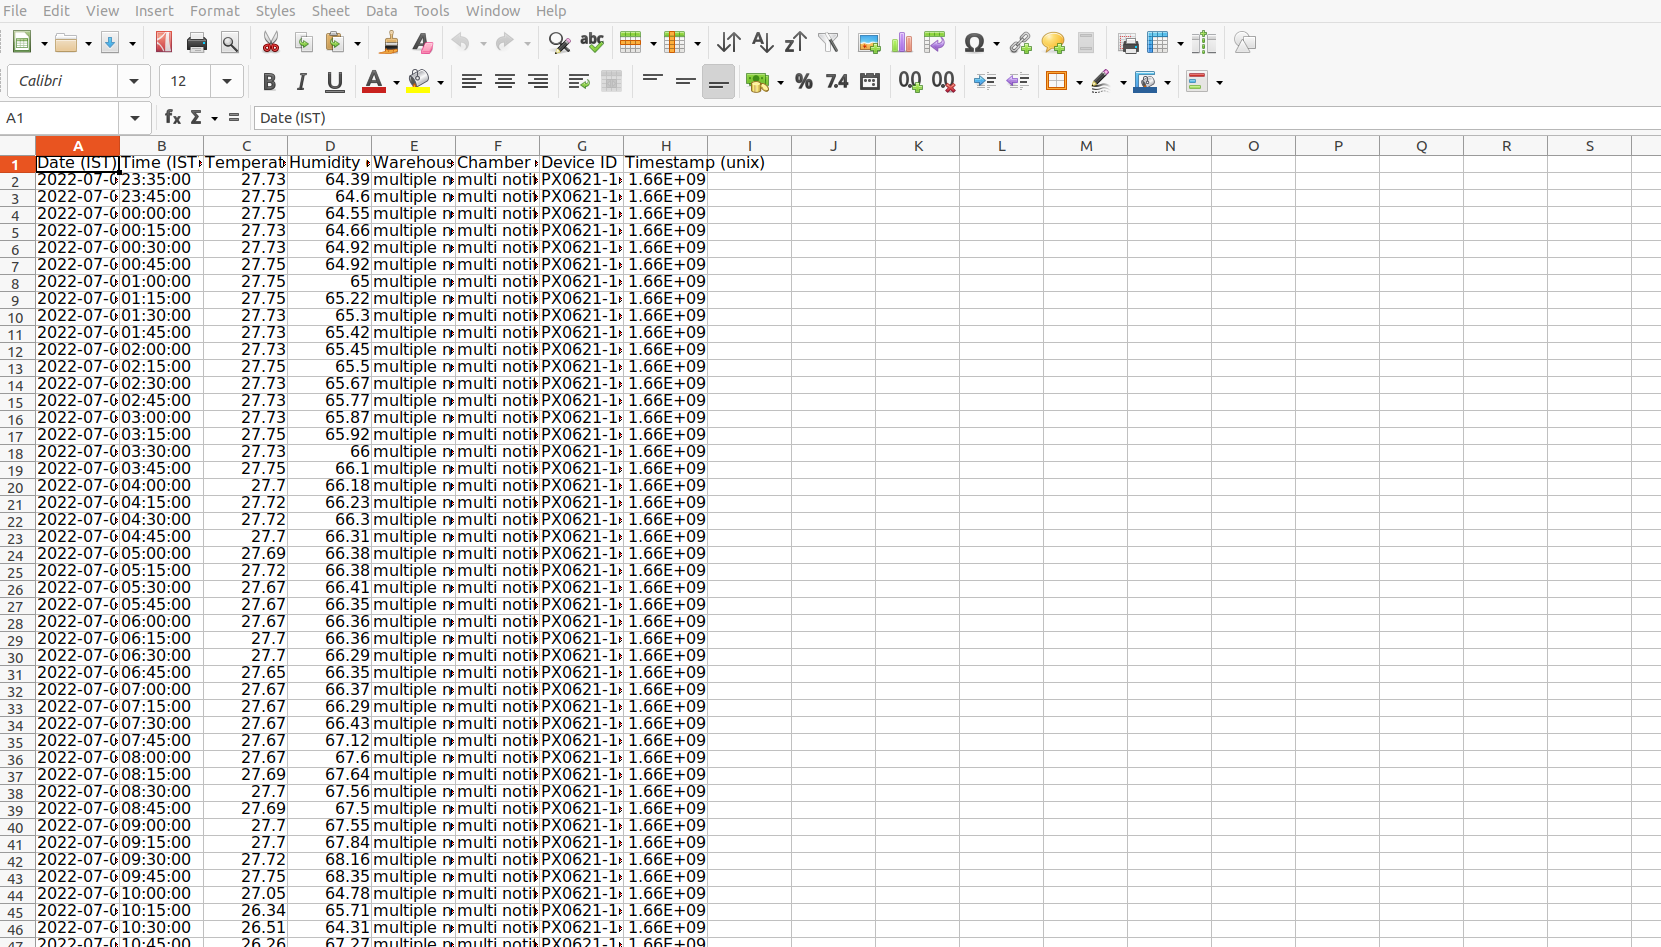
Following is the example of Excel report.
Alerted Chamber Section#
The Alerted Chamber will show you the infomation about the devices which are currently under violation , the violation can be related to temperature , humidity and battery.
note
When a device crosses the threshold, it is considered to be in violation.