Dashboard
Dashboard is divided primarily into two parts
We'll first talk about Live section and then see how the overview of it is presented.
Live Section#
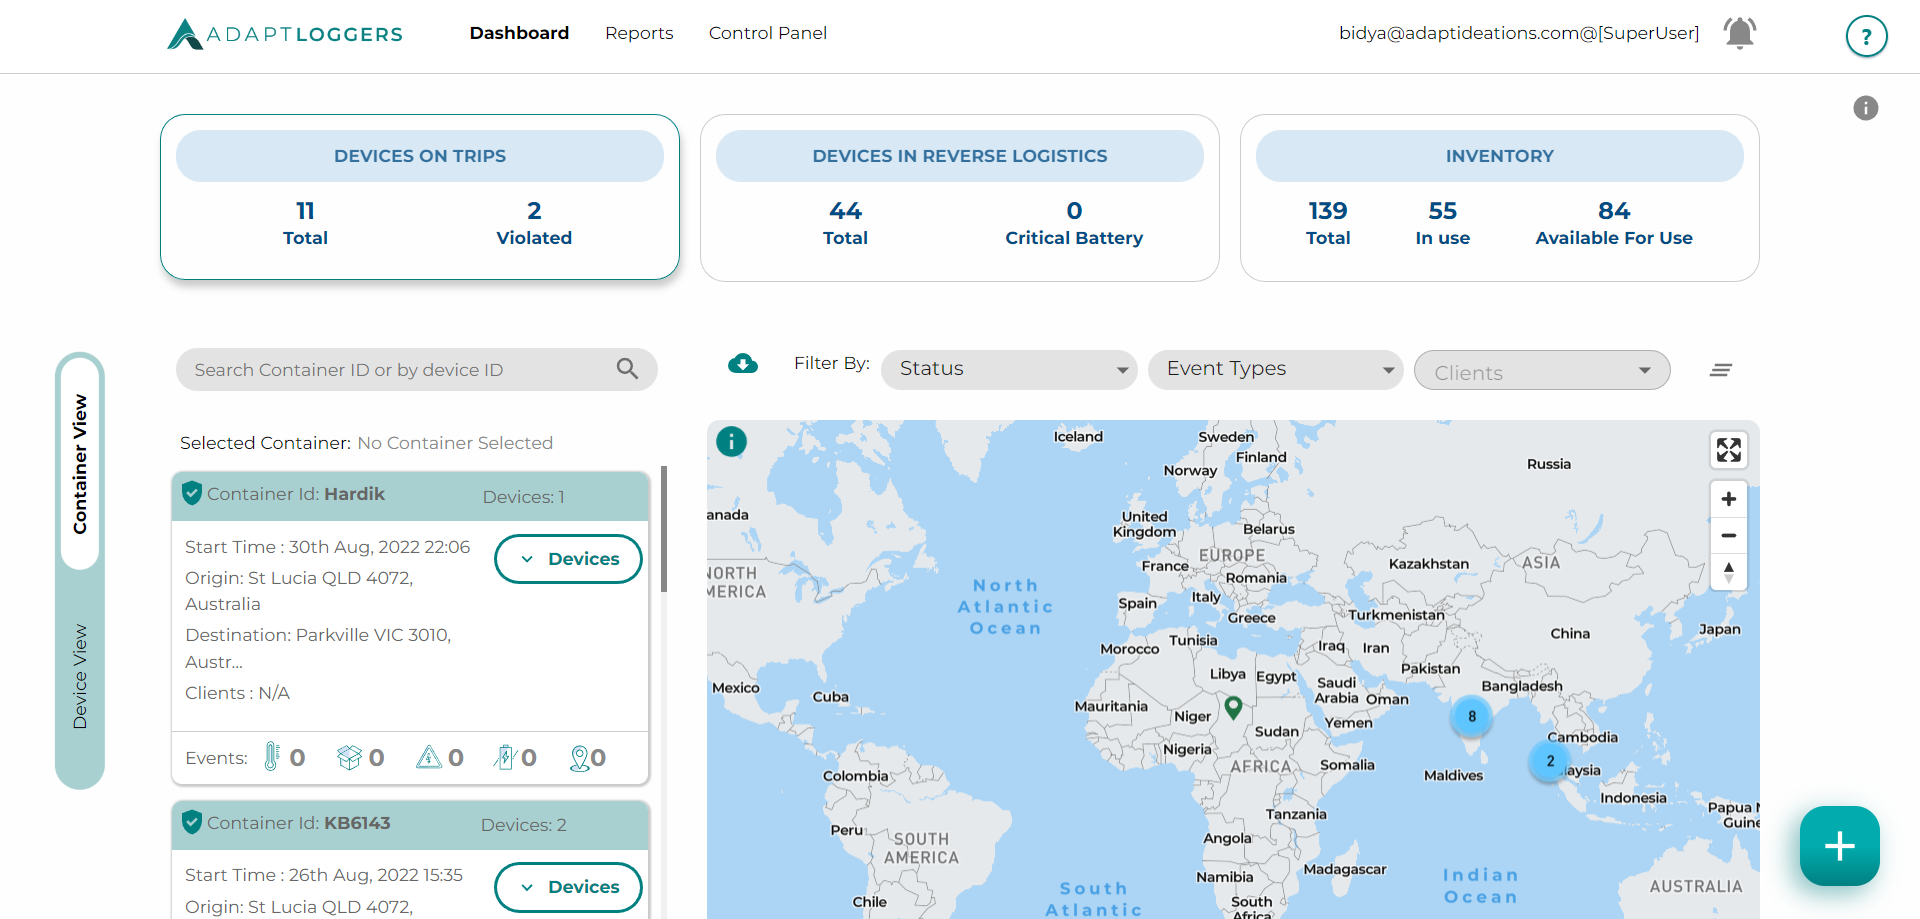
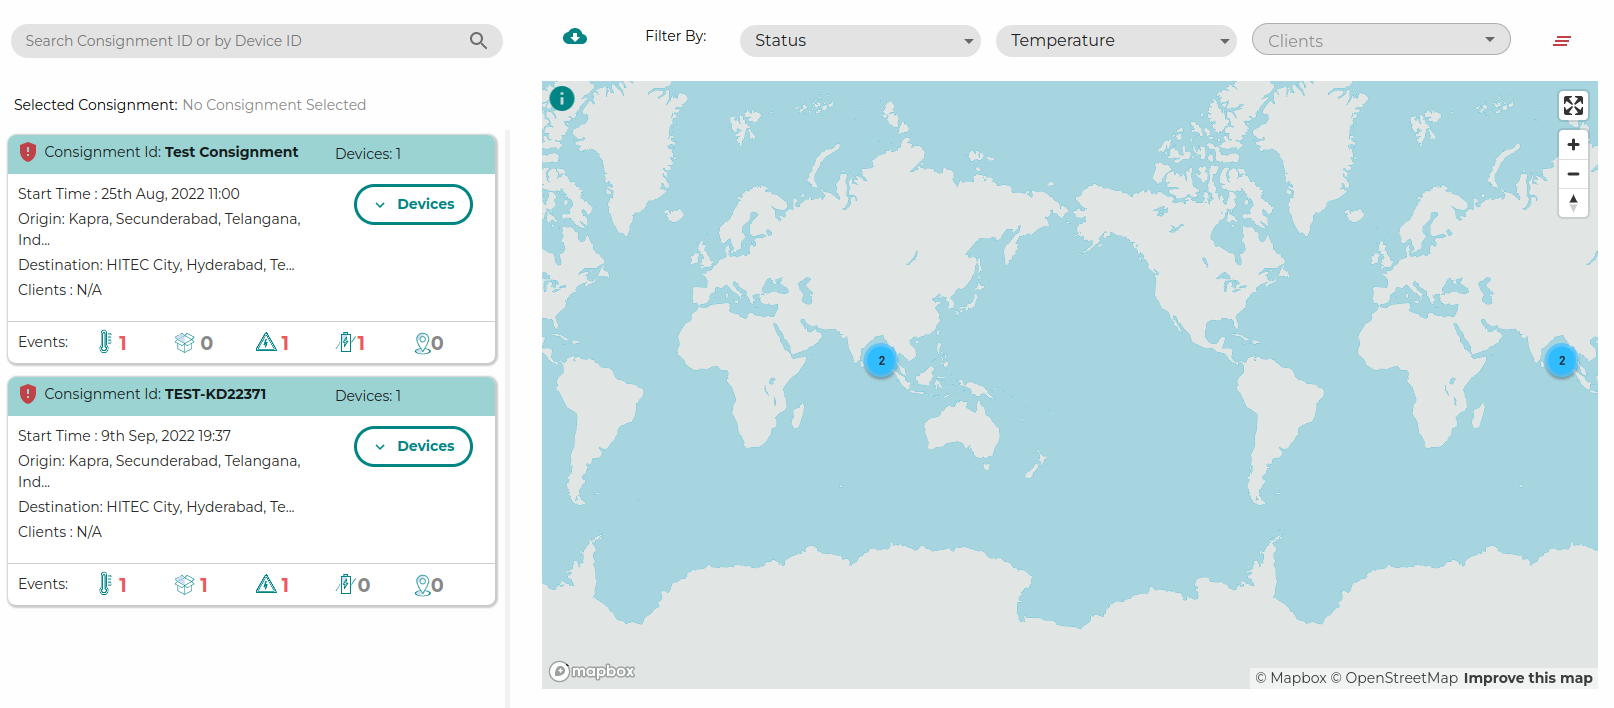
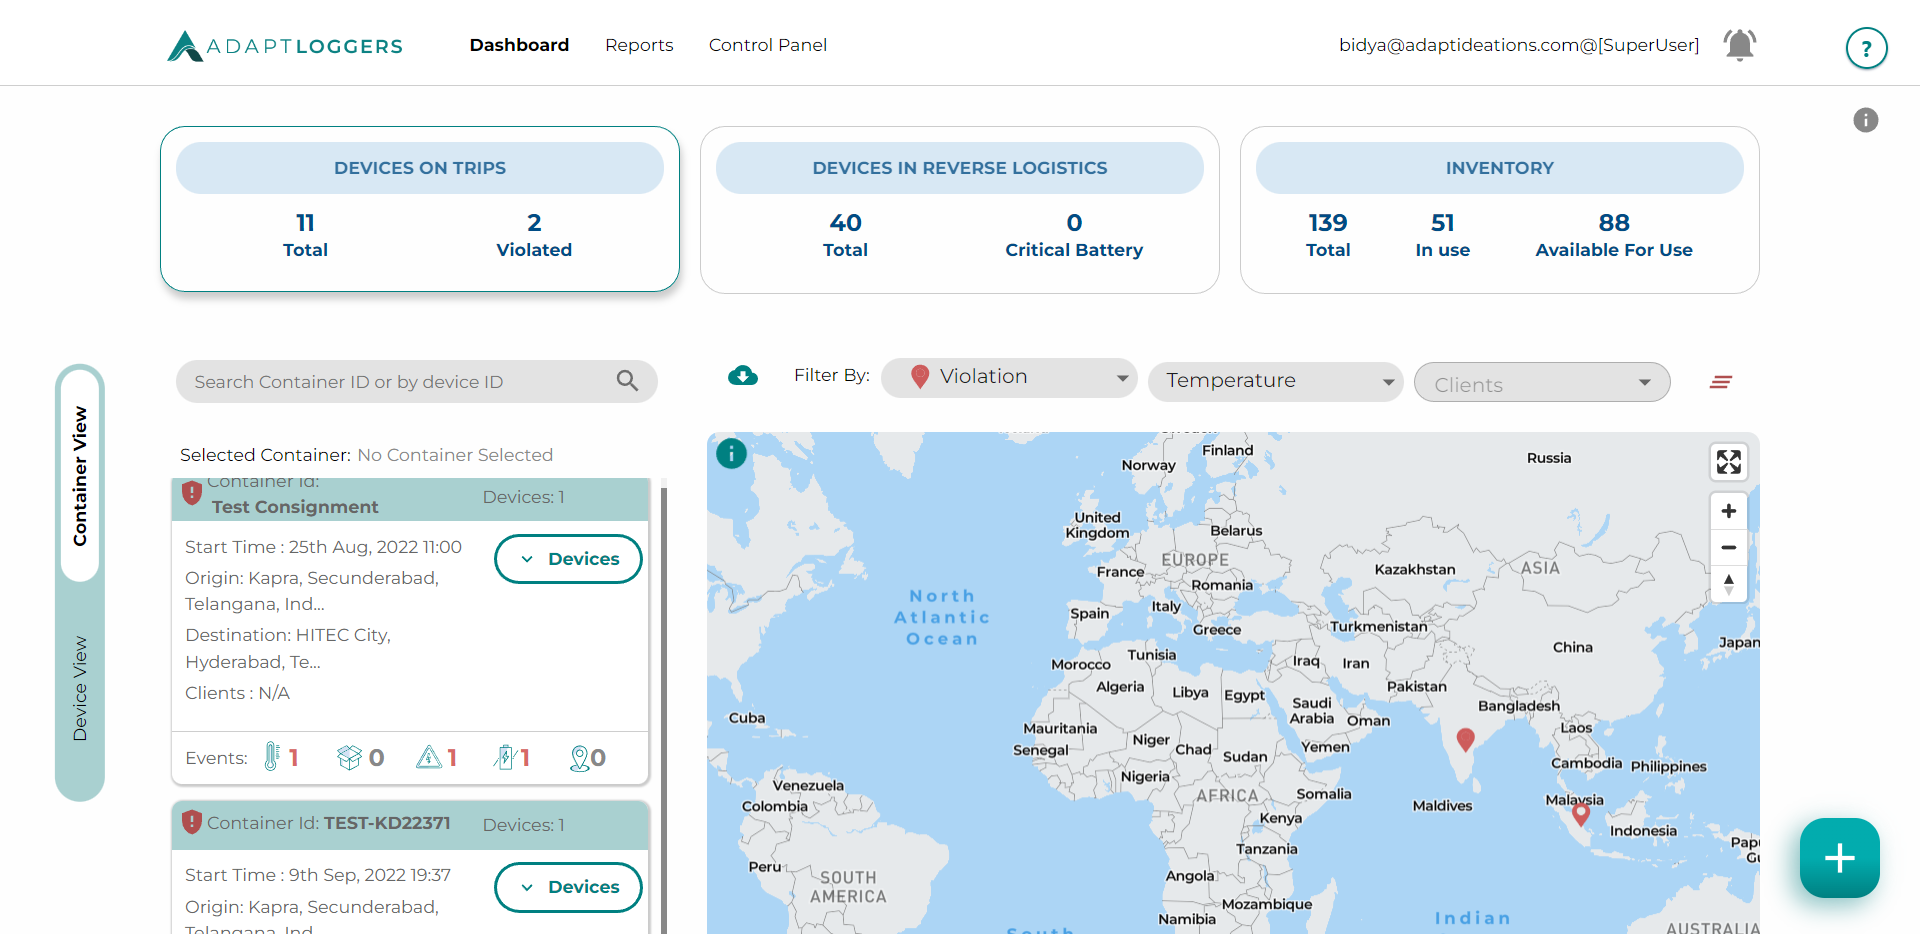
The default view will be a map with live consignments represented as clusters.
The left-hand side of the map displays a list of live consignments with information regarding the number of assets in the consignment, trip details of the consignment, clients present the consignments. Also, at the bottom you will have all the temperature events, box-opening events, shock events, geofence events and battery events in the consignments. On map, blue coloured clusters appear if the device count is more than one.
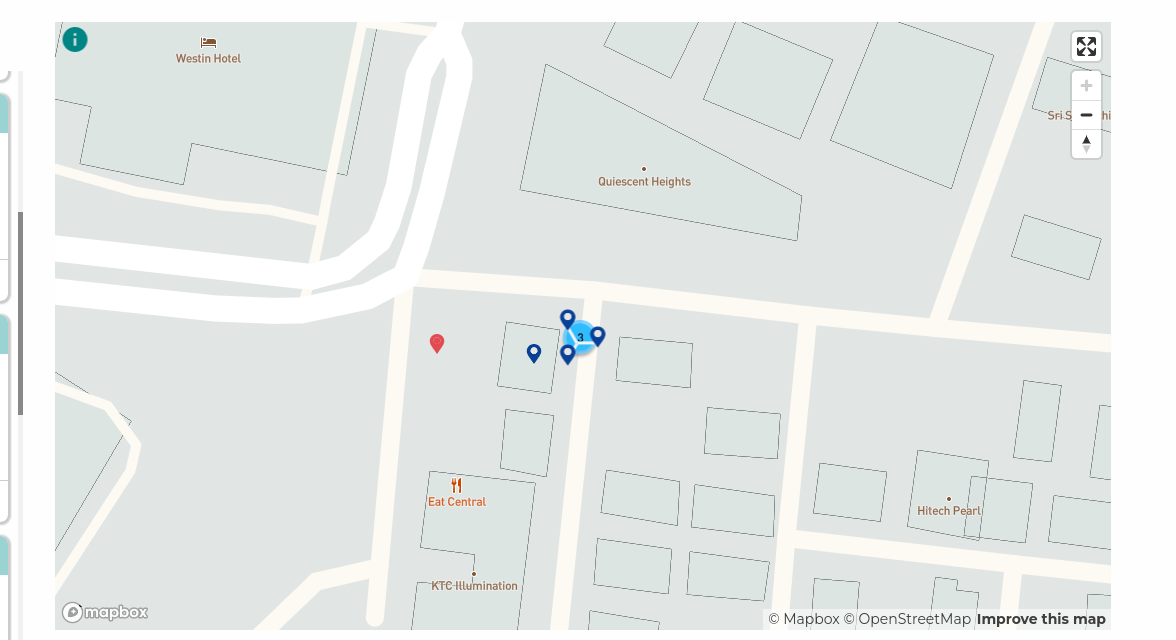
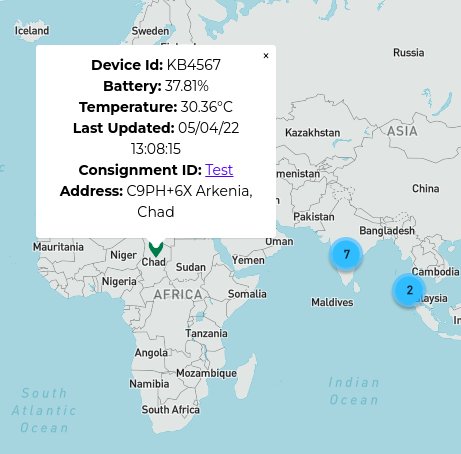
Clicking on a cluster will further zoom into the location and display assets as different coloured pins (Red, Yellow, green, Purple) (Red= consignment has violation, Yellow= consignment has temperature warning, Green= consignment in excellent condition, Purple= devices in reverse transit) on the map. The number inside the circle indicates the number of assets/devices at that location. Further, clicking on any given point will give you further details about the consignment.
We can see the timestamp when the location was last updated by clicking on view devices on the consignment card on the left-hand side of the screen, you can also see the path the device has travelled if you click on the device card.
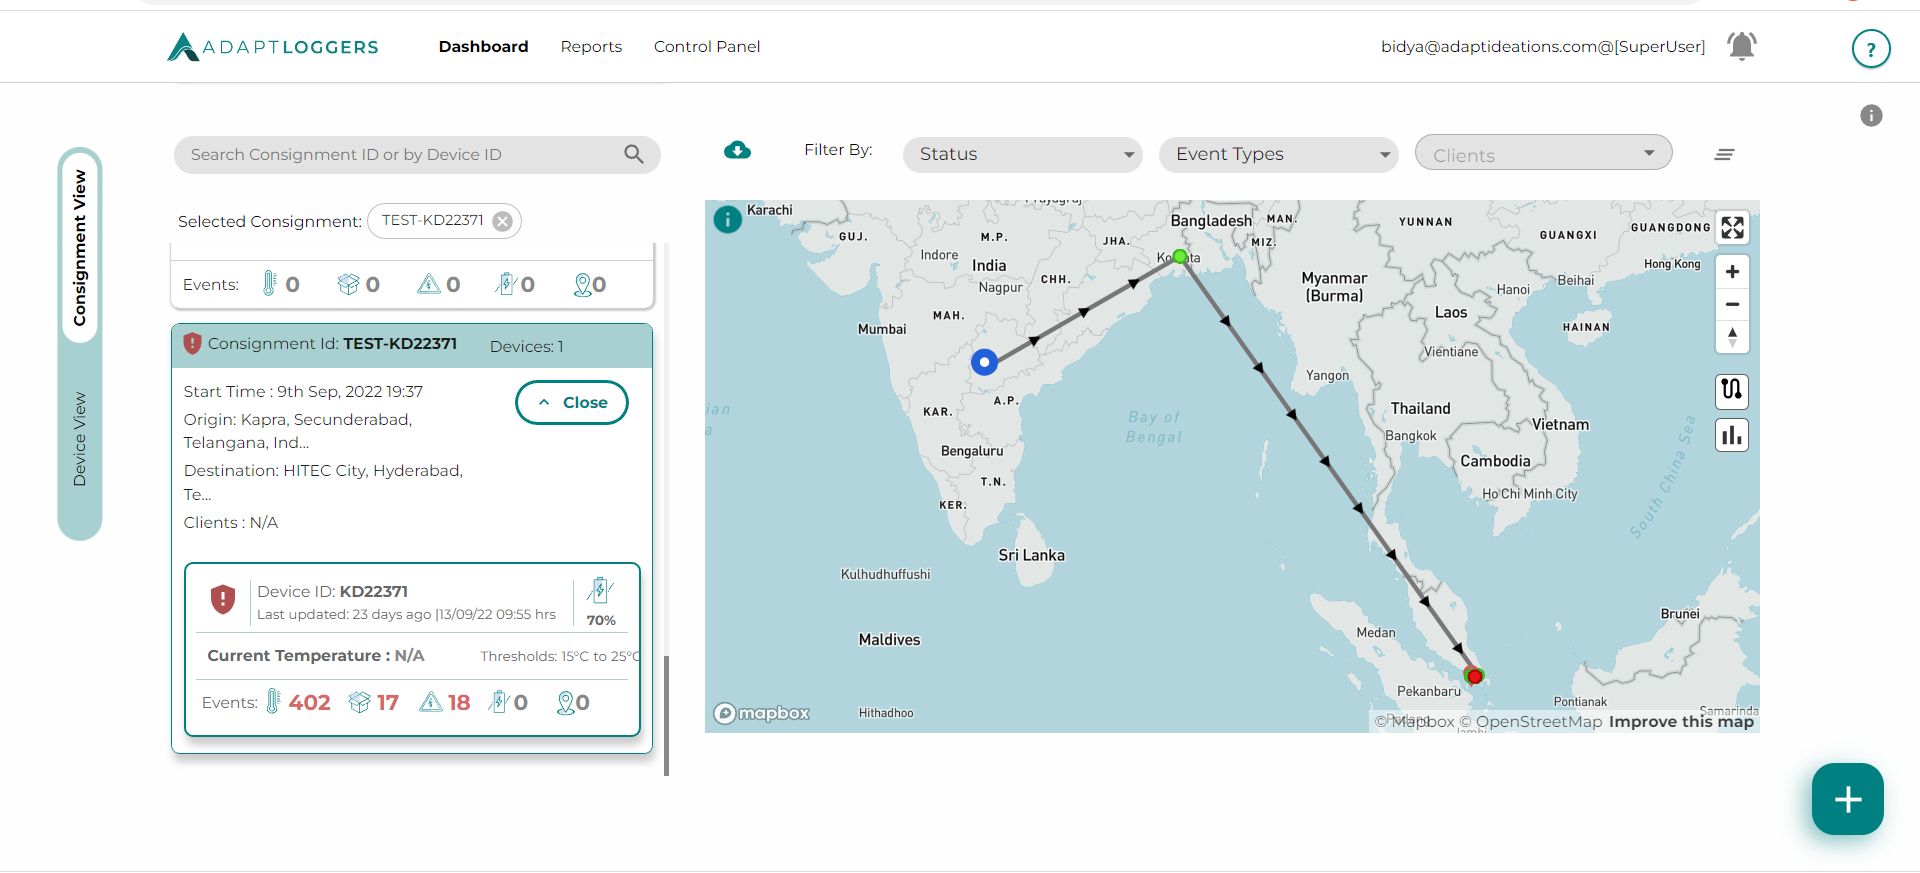
You can select devices by clicking on the device cards and view temperature data as well.
Users can also see the last updated time at a particular location by clicking on the purple marker. A consignment card will display a small green icon of an aircraft if the consignment is travelling by air
Checking device data#
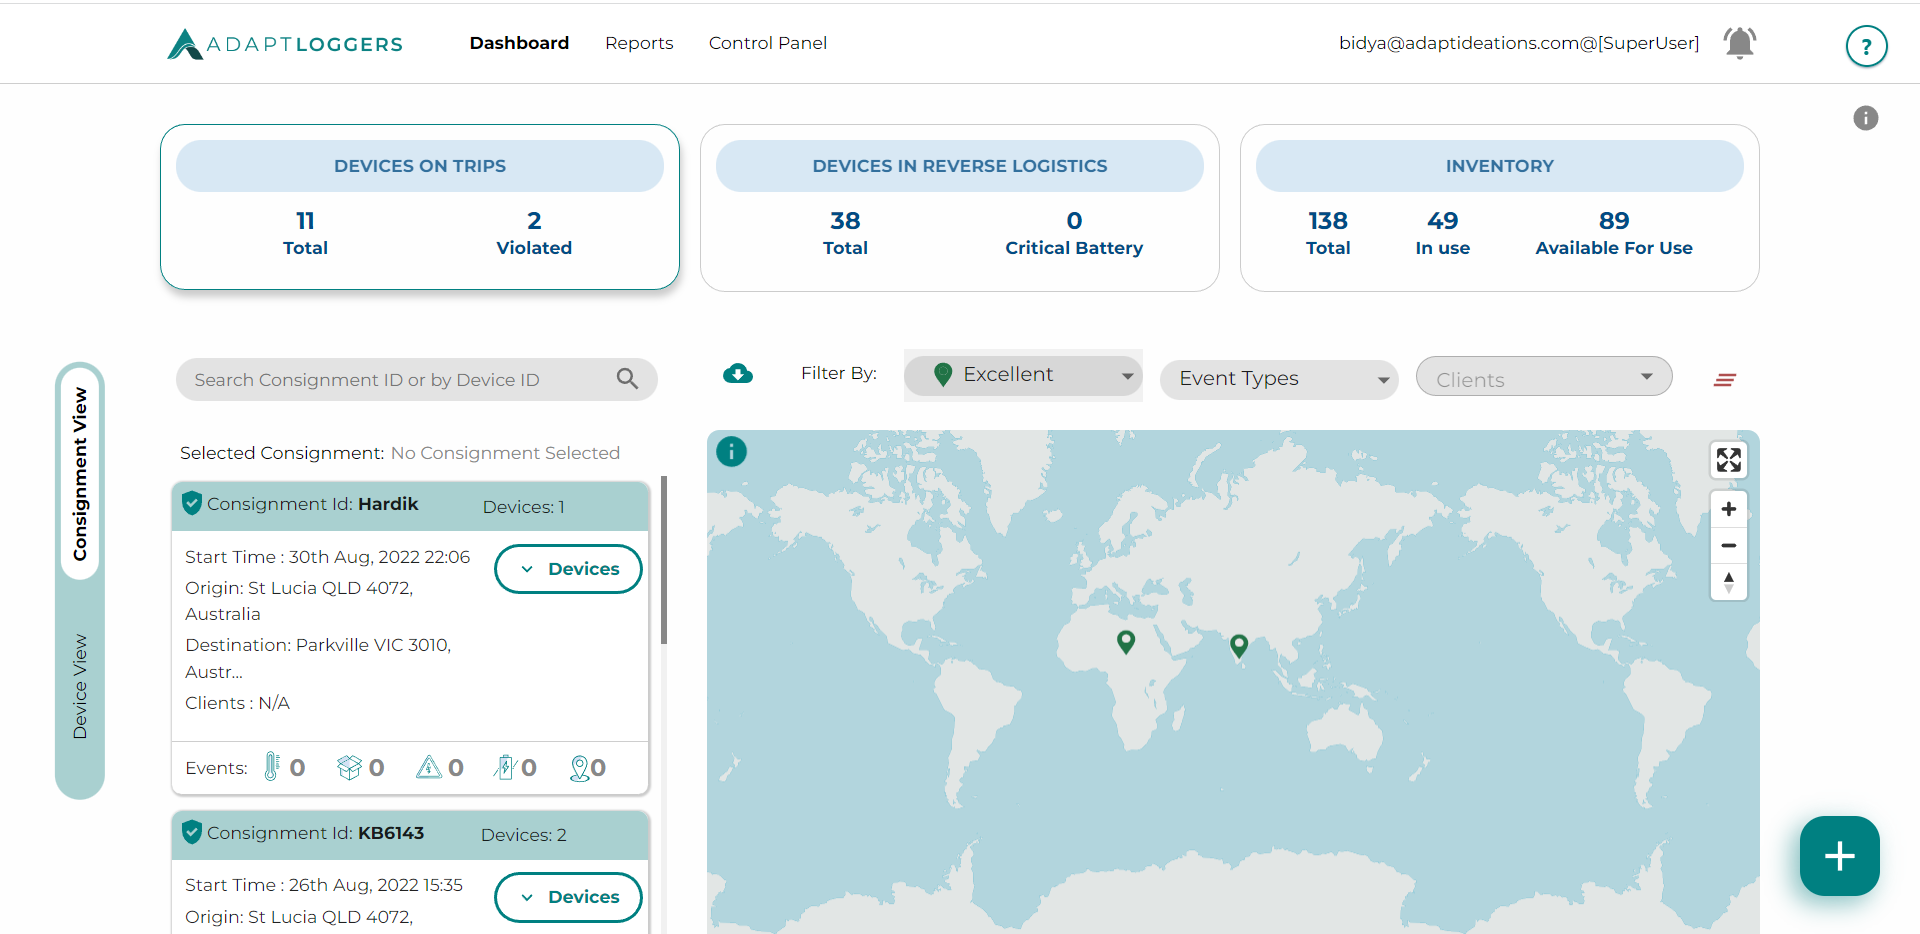
To view assets belonging to a specific consignment on the map, select the consignment from the list. The individual assets or devices from the selected consignment will be displayed as per the status of the device(red marker for violation, yellow marker for warning, blue marker if device is in reverse transit, green marker for excellent). Also, a temperature graph displaying the current temperature recorded by each device will be displayed.
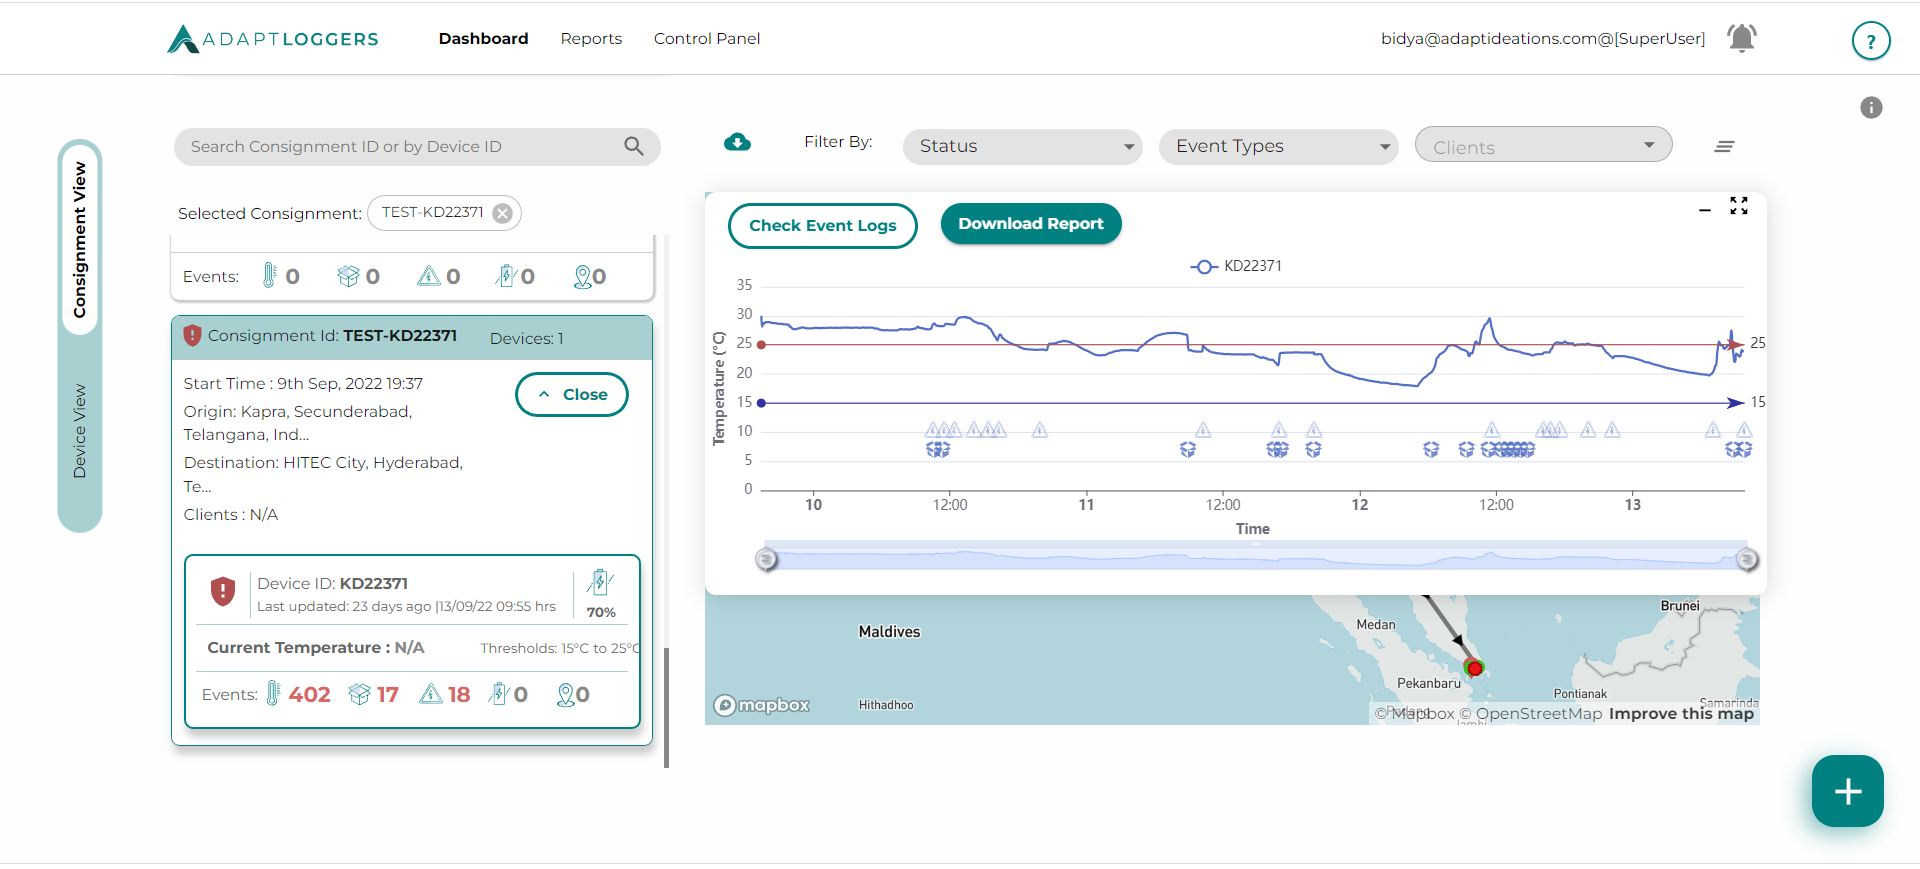
Click on a device from the device list on the left-hand side to view the exact path of the device on the map. A temperature graph is also displayed for the selected device.
Check Event Logs for Device#
To view event logs click on consignment card to select a consignment and then click on device to view the temperature graph and path travelled by the device. On the temperature graph you can click on Check Event Logs to view event logs for the device.
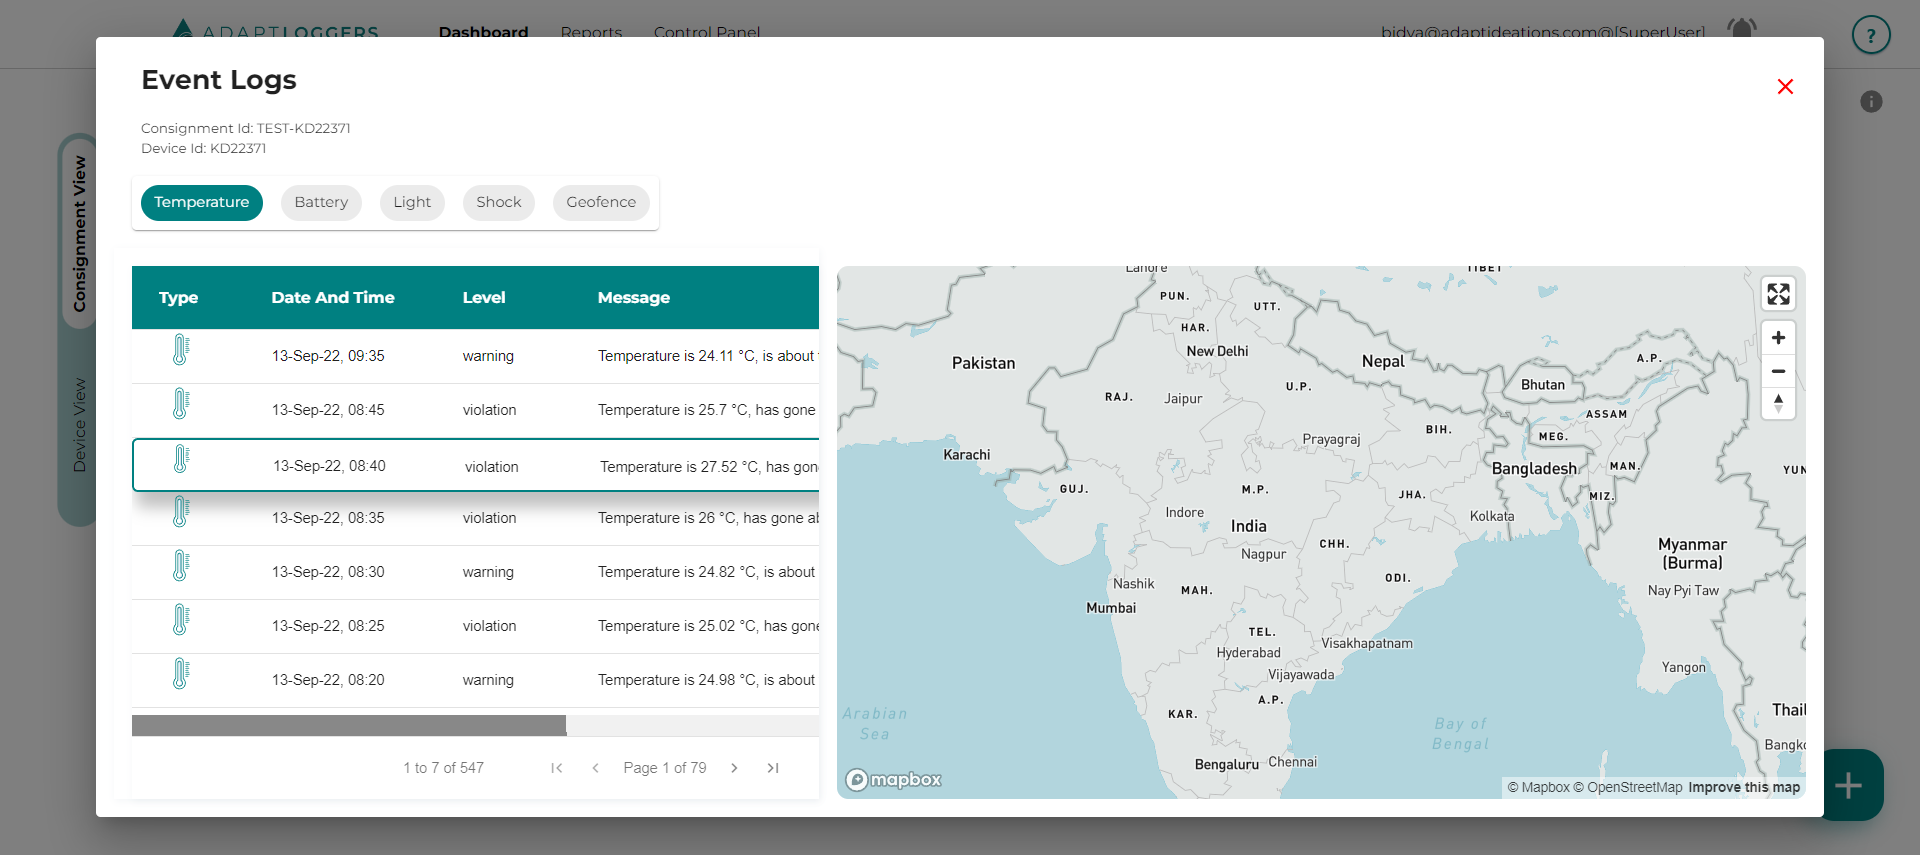
You can filter using the temperature, box-open, battery, shock, geofence events and also view the location of events by selecting one row from the events table.
You can also Download Ongoing Consignments PDF by clicking on download report beside the check event logs button.
Filter By Clients#
Right Above the Map you will also see a drop-down menu containing the name of every client that has been registered to the account. By selecting any of the clients you will be able to filter out consignments only assigned to their accounts giving you a better snapshot of all the pertinent data.
Filter By Event Types (Temperature, light, battery, shock)#
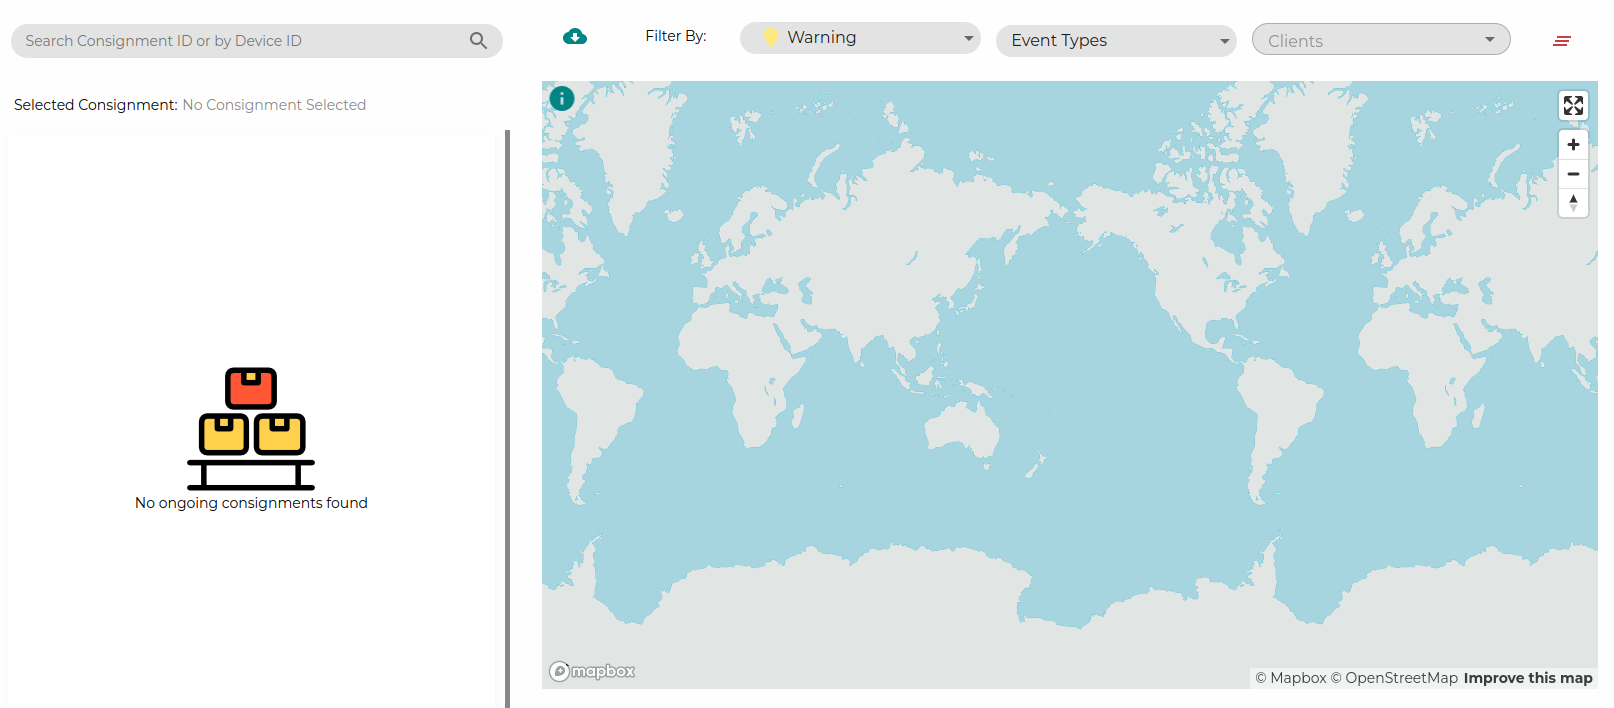
We will be able to filter ongoing consignment via using the violations filter, and consignment with the selected filter violation will be filtered.
Filter by Marker colour (Red, Yellow, Green and Blue)#
User will be able to filter ongoing consignment via using the colour marker filter, and consignment with the selected marker colour will be filtered.
Below is the meaning if different marker colours
- Red coloured marker means device has experienced a temperature, light, shock or a low battery violation during its consignment journey
Yellow coloured marker means device has experienced a temperature warning during its consignment journey
- Green coloured marker means that the device is in excellent condition and have not experienced any violation or warning
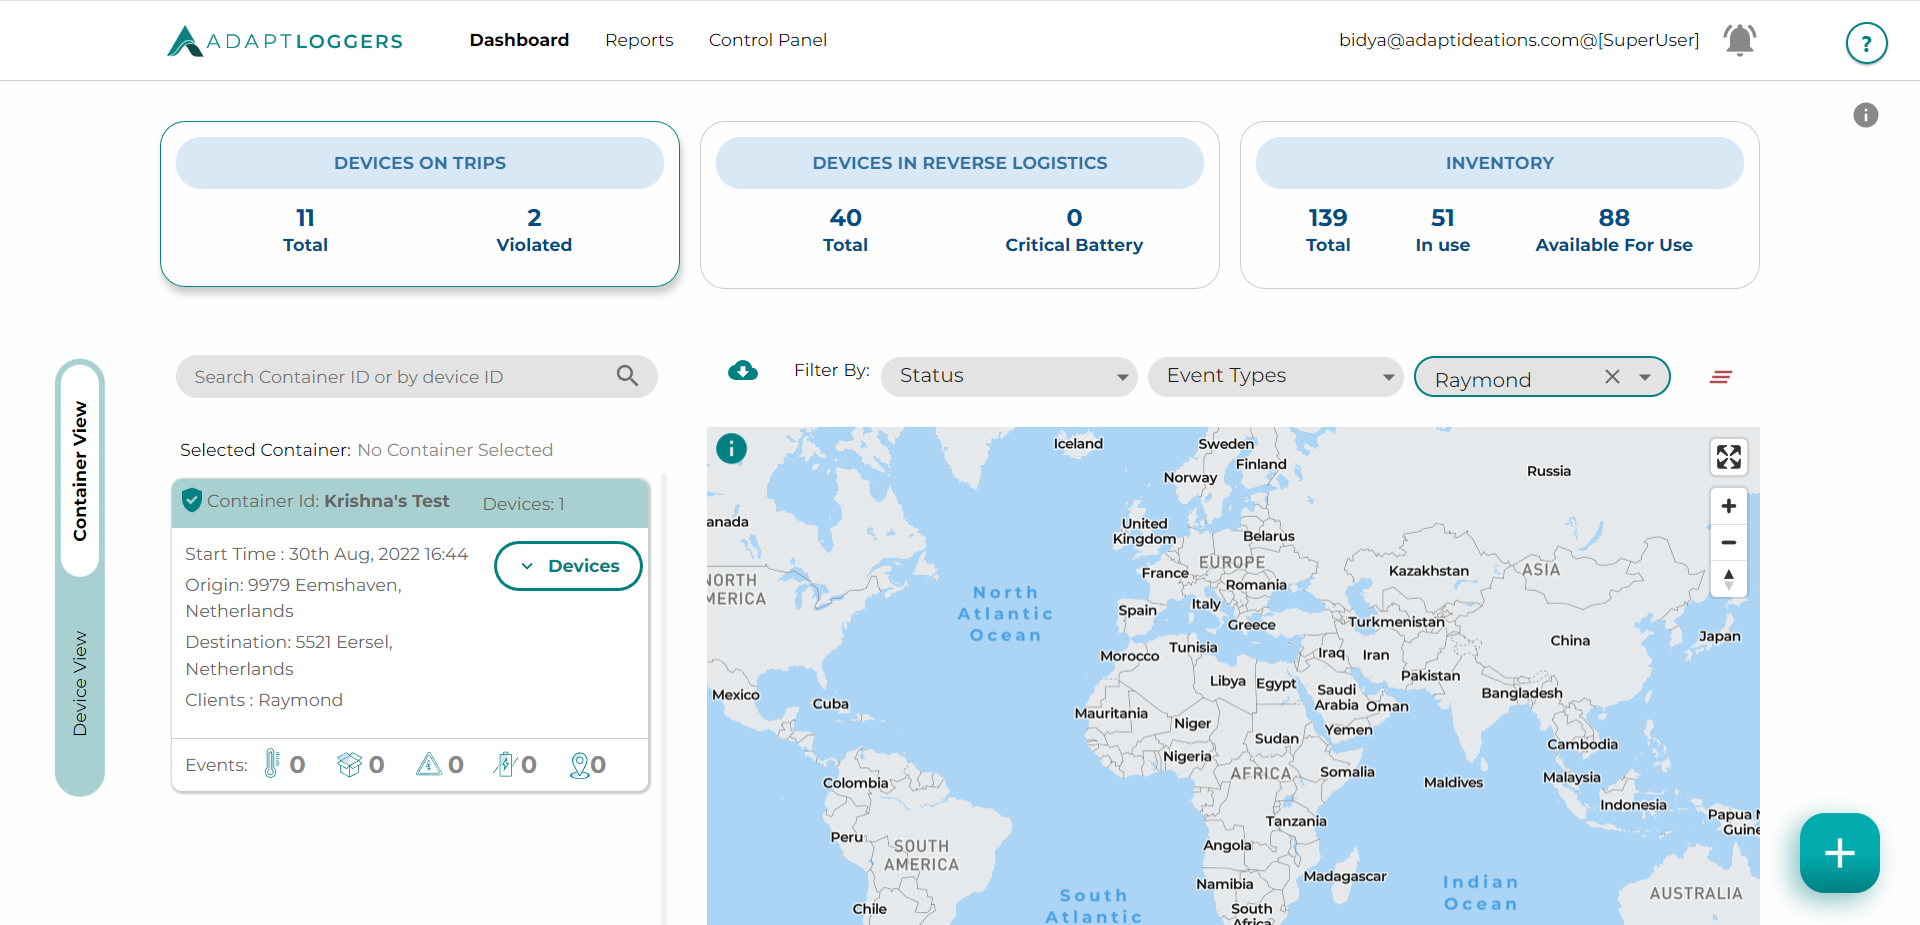
Overview Section#
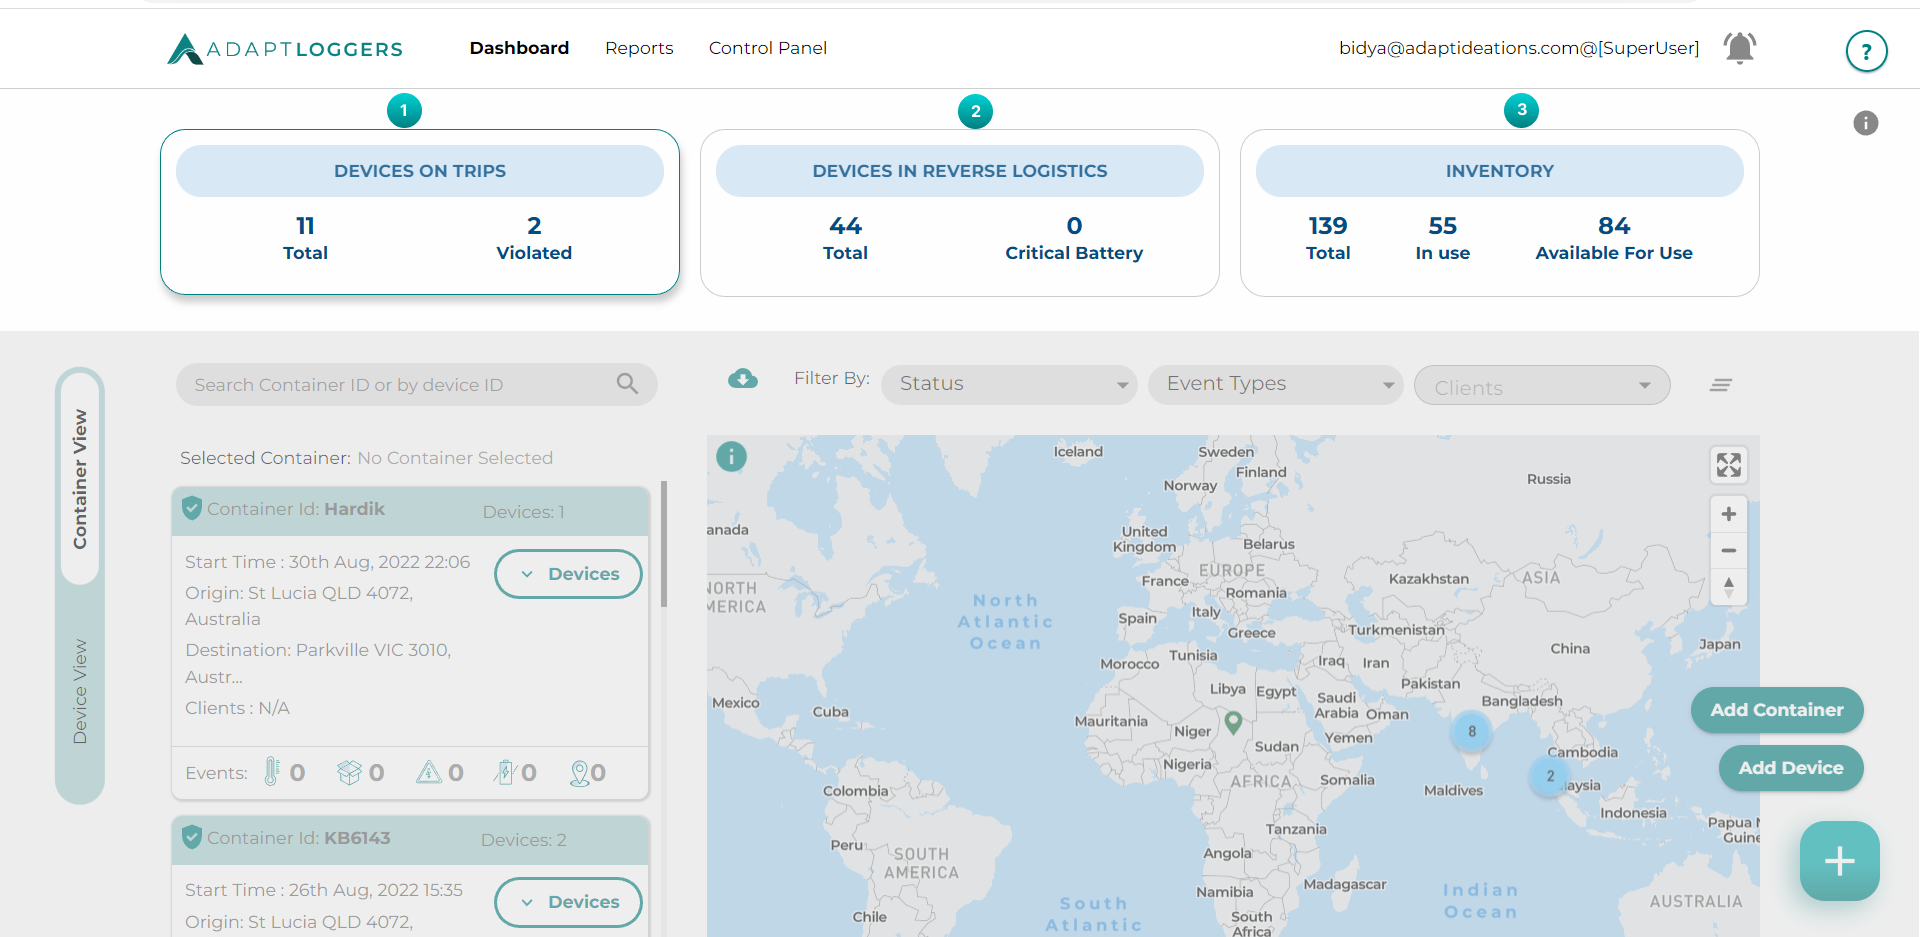
In this section there are 3 cards which gives an overview of kelvin devices and the cards are as follows
- Devices (assets) on trips.
- Devices (assets) in reverse logistics.
- Inventory.
By default, the user will be routed to “devices on trips” card. This card shows the number of total devices which are currently on trip along with the number of violated devices. On hovering over these numbers, users get additional information about the devices, such as number of events for all devices and number of devices in consignments.
The second card(reverse logistics card), displays battery level information regarding devices that have completed consignments and are not yet paired and hence are not part of any ongoing consignment. Once you click on it you are redirected to the reverse logistics page where you can see the list of devices that are in reverse logistics along with their location.
The third card (inventory card) displays the number of devices that are not yet paired and hence are not part of any ongoing consignment. Once you click on it you are redirected to the controlpanel ----> devices page where you can see the list of devices that are in inventory along with their location.
In Reverse Transit#
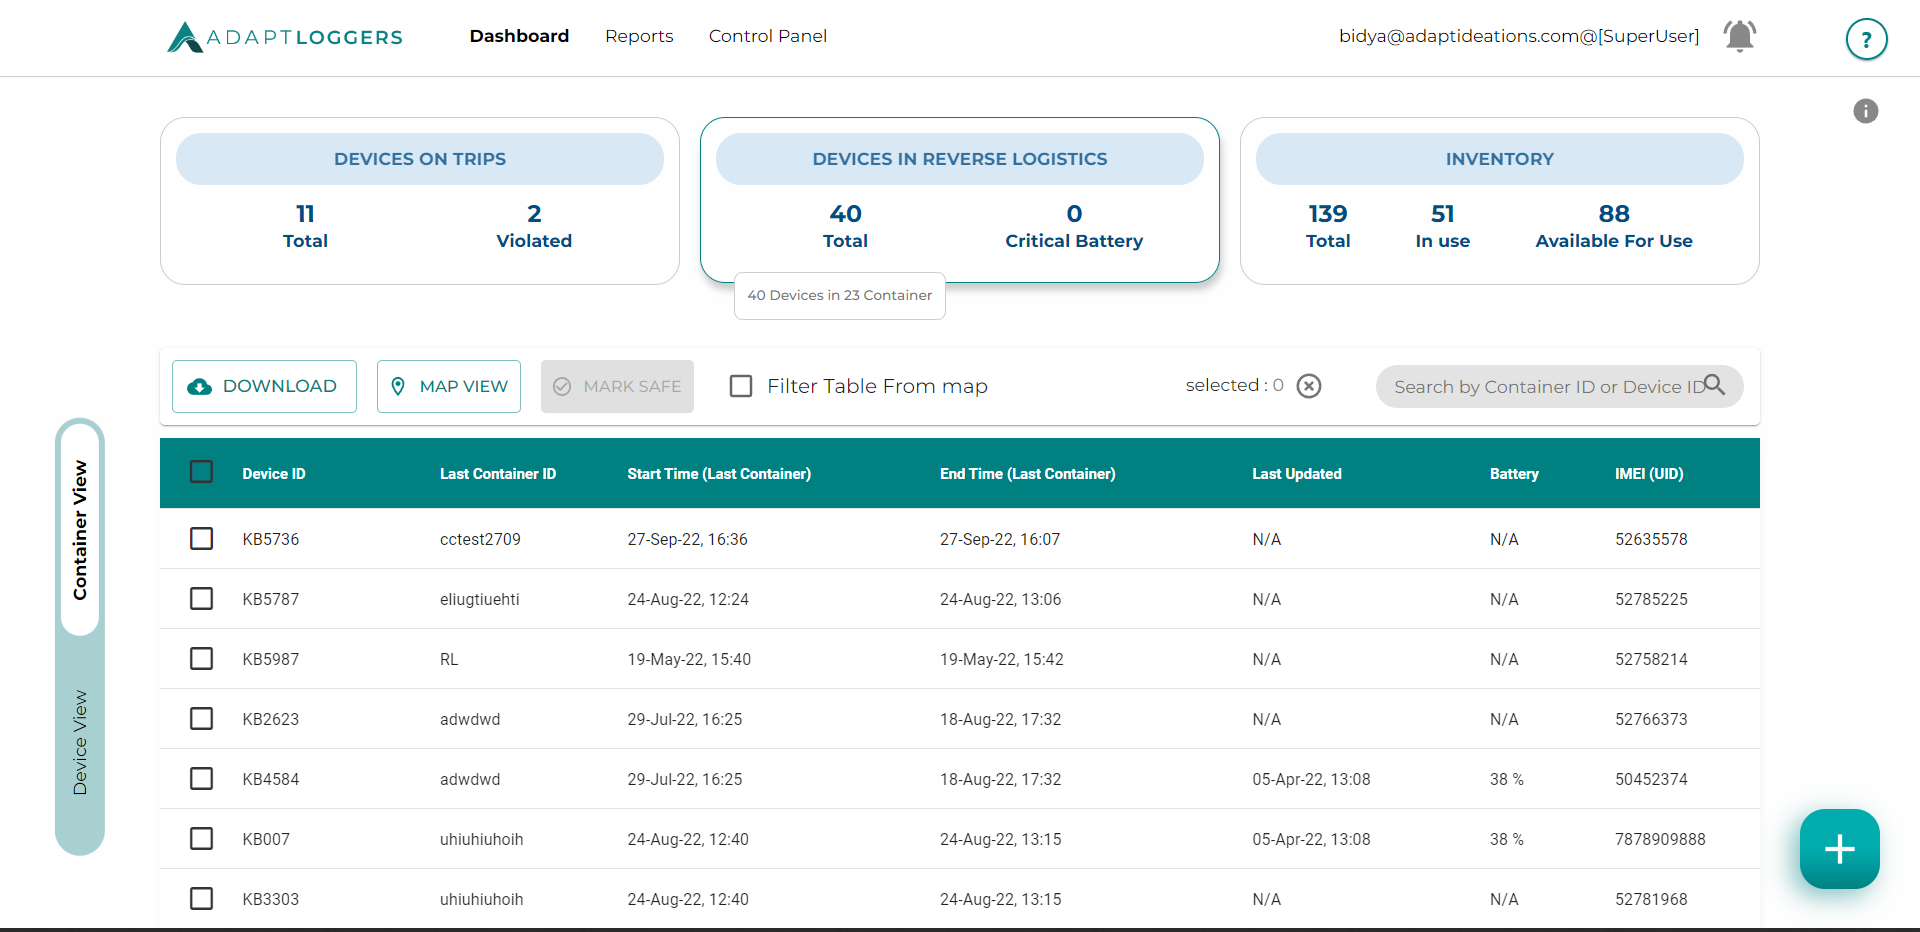 This section shows devices which are in reverse transit, you can view last updated, battery level, location, last consignment details such as start time, end time.
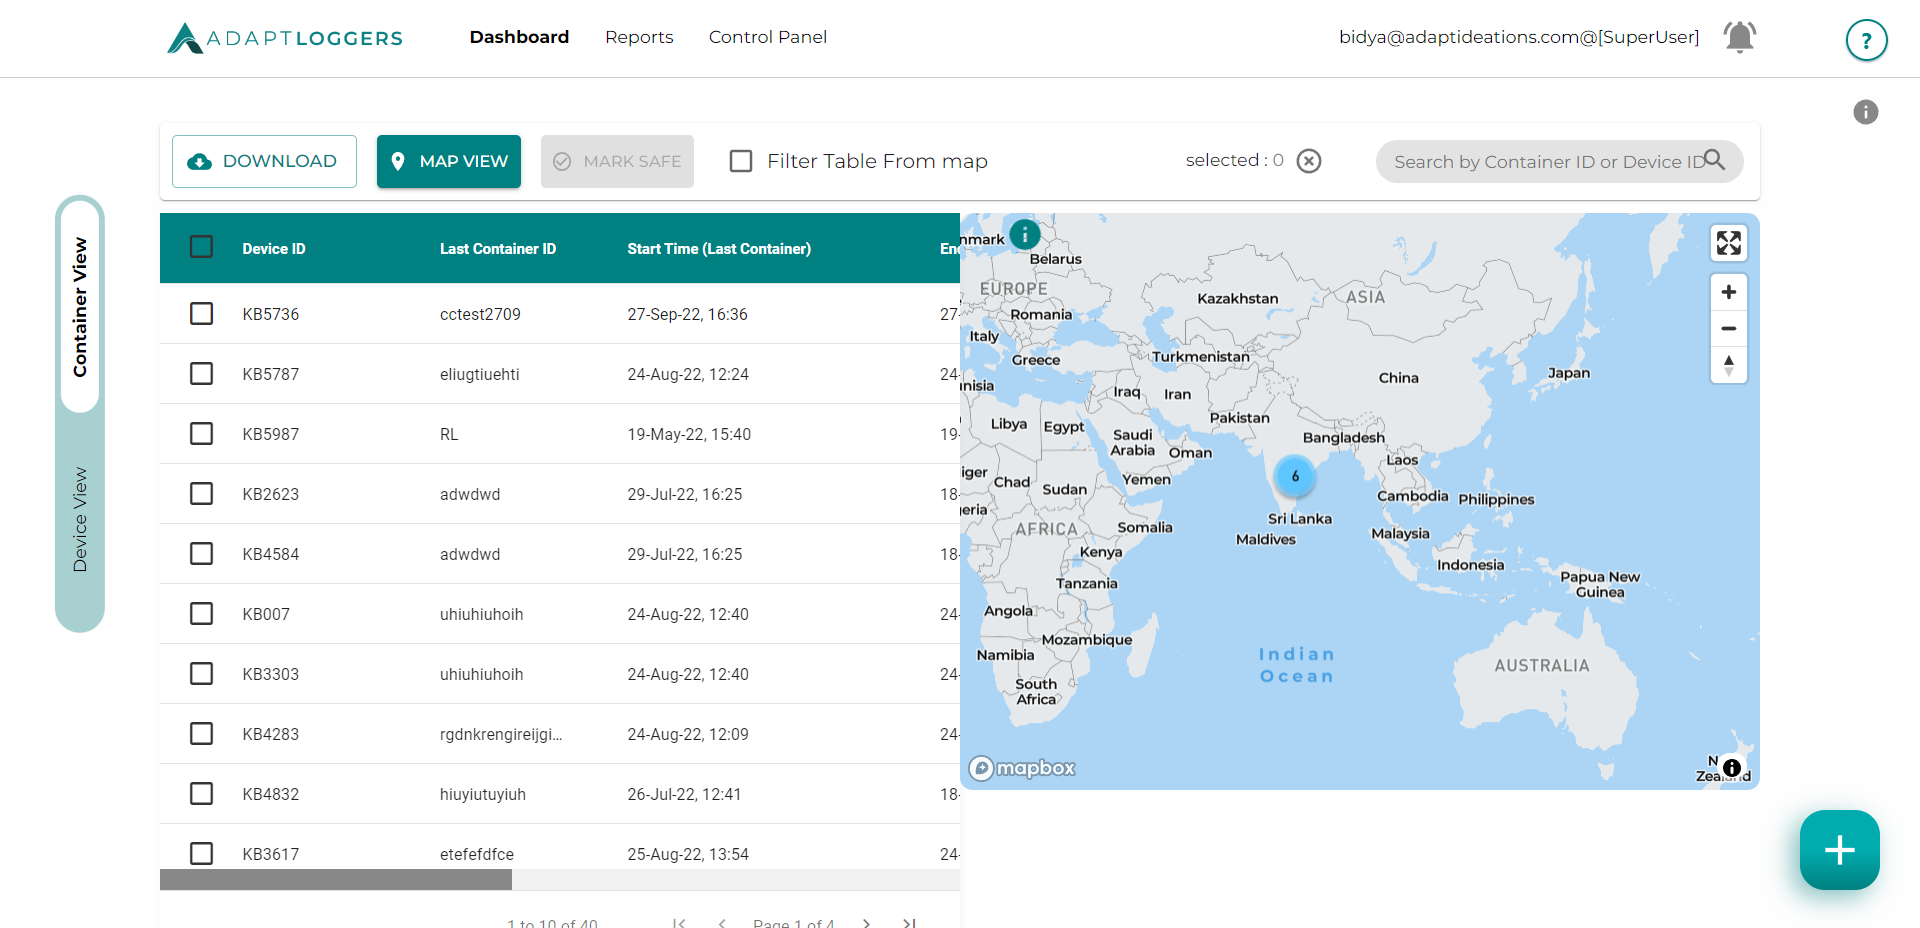
Map View#
You can also click on Map View to have the location of the devices.
Marking devices safe#
You can manually mark these devices as safe, by selecting the device ID and clicking on Mark Safe. This feature can be used to specify that a device has reached the owner's/sender's warehouse and has been added to the inventory to be used for the next consignment.
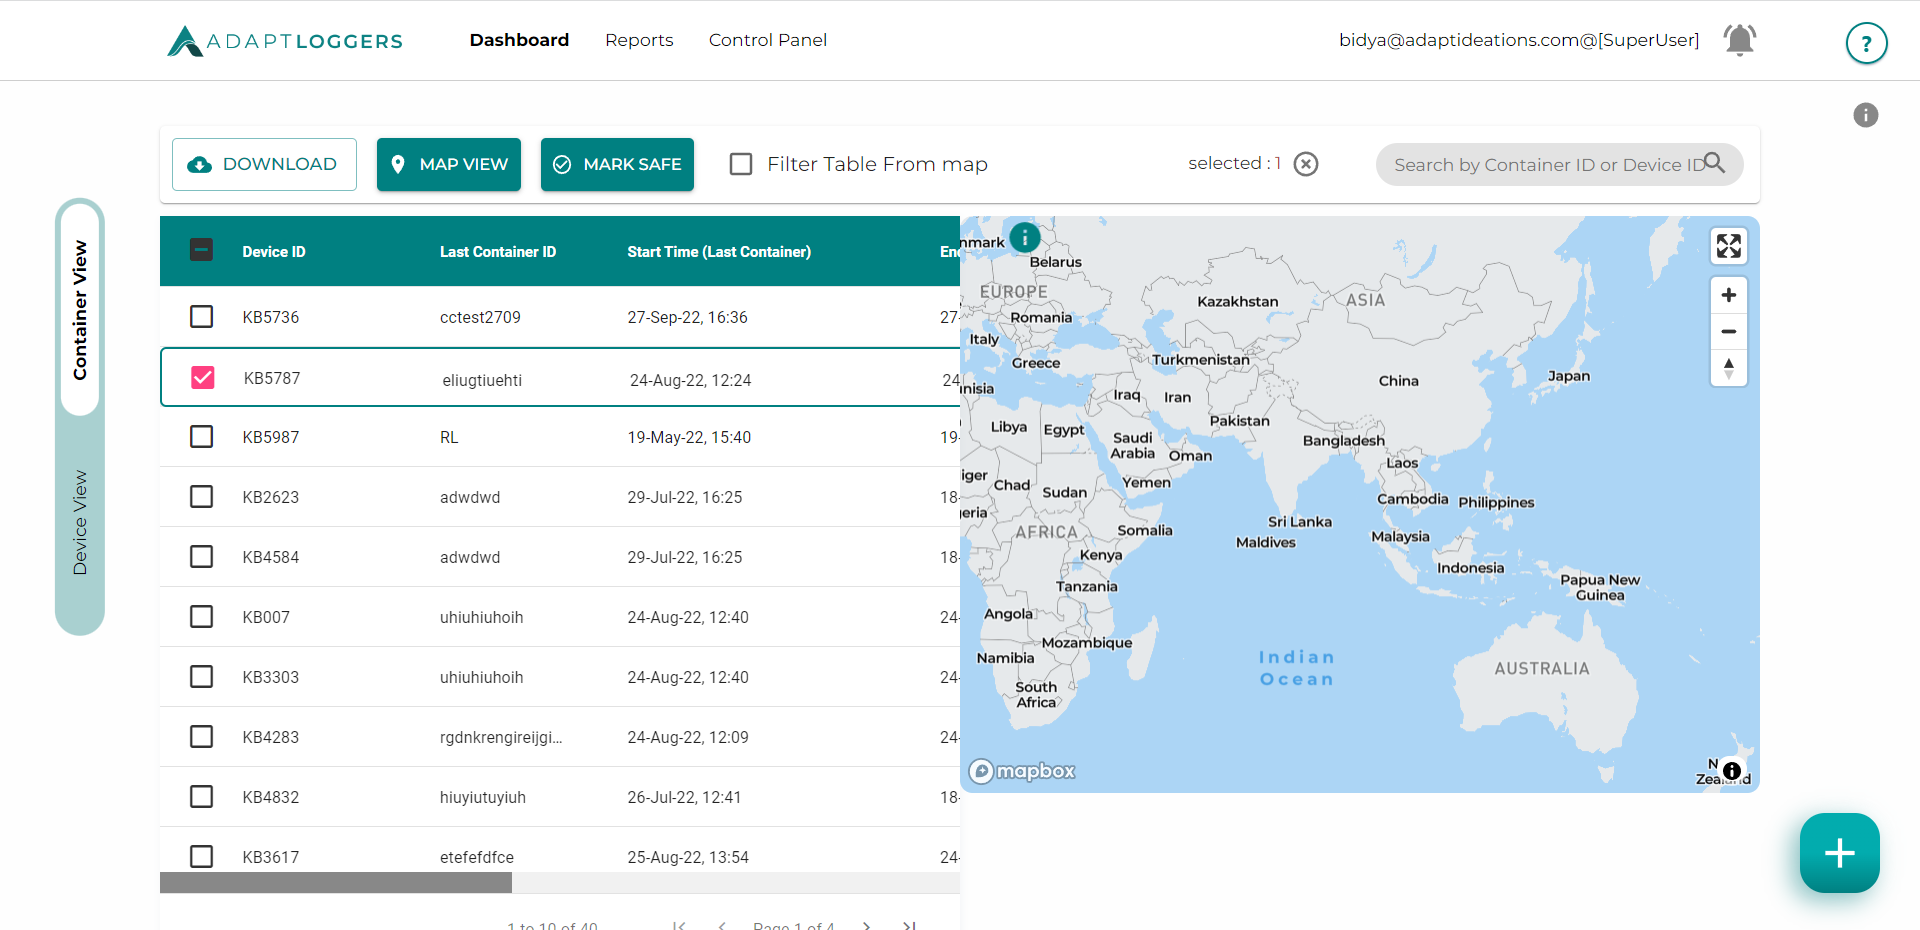
It is recommended that when the device comes back to the sender's warehouse, the admin should manually mark the device as safe. Doing so it will automatically add it back to the inventory. Even if it is not marked safe, user will still be able to assign the device to the next consignment and add the device will automatically be removed from the reverse logistics section.
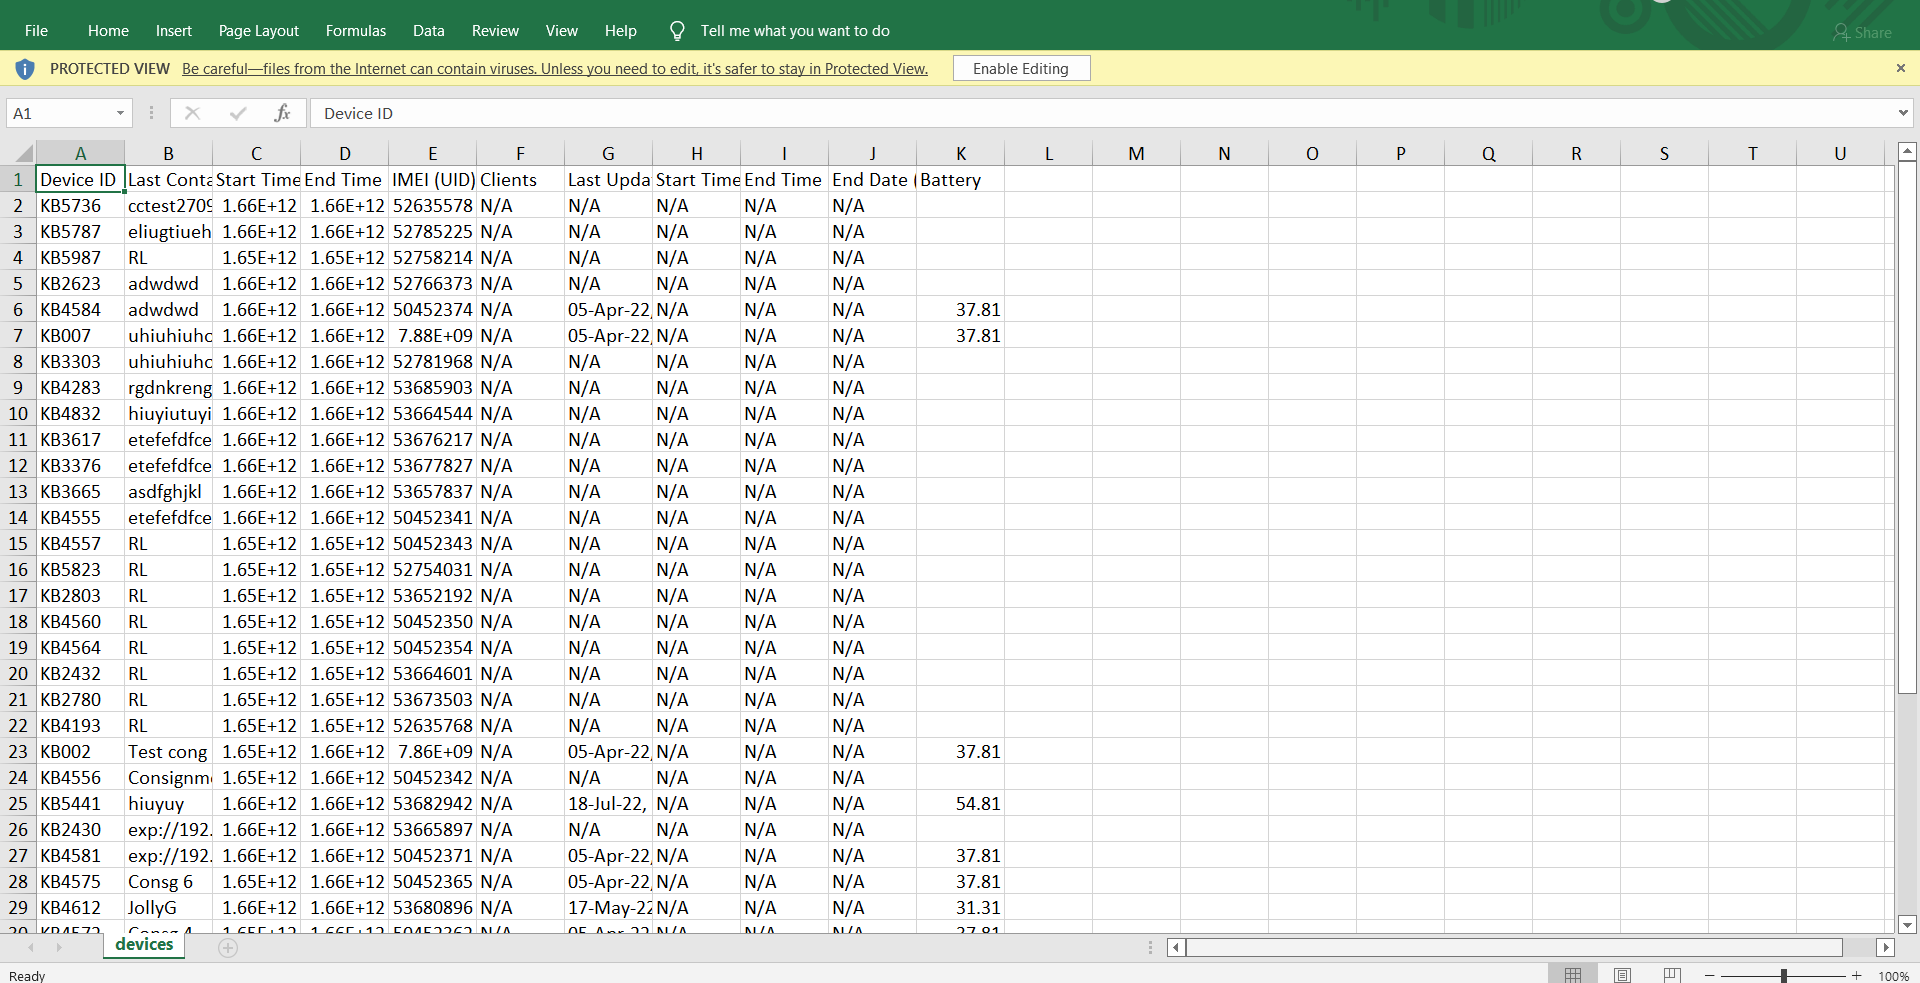
Download Device Data#
To view the data of reverse logistics in the excel sheet, click on the blue coloured Download button.
An Excel sheet will be downloaded with the data of reverse logistics.
Next, we'll look into how any events in the ongoing consignments can be checked.