Reports
The Reports section in the portal facilitates the generation of PDF and Excel reports for past consignments. Reports can be generated at the consignment level as well as at the device level. The reports page consists of the following two sections:
note
Reports Section consists of reports for previously ended consignments. An interim report for the ongoing consignments can be downloaded from consignments tab in Control Panel section.
Overview of Consignments#

This section displays an overview of past consignments, such as:
• The number of consignments.
• The number of devices.
• The success matrix, representing the number of violations.
• A percentage of temperature, box-opening, shock events and low-battery alerts.
By default, data is displayed for consignments within the past 1 week. This can be changed using the time period drop down. If custom is selected, users can set dates using the from and to date pickers provided.
note
The date selected from using from and to date pickers would filter out consignments started during that period.
note
You can also filter consignments which have been violated or healthy by clicking on the Consignments with events or Consignments without events button. To view all consignments click all button
Finished Consignments#

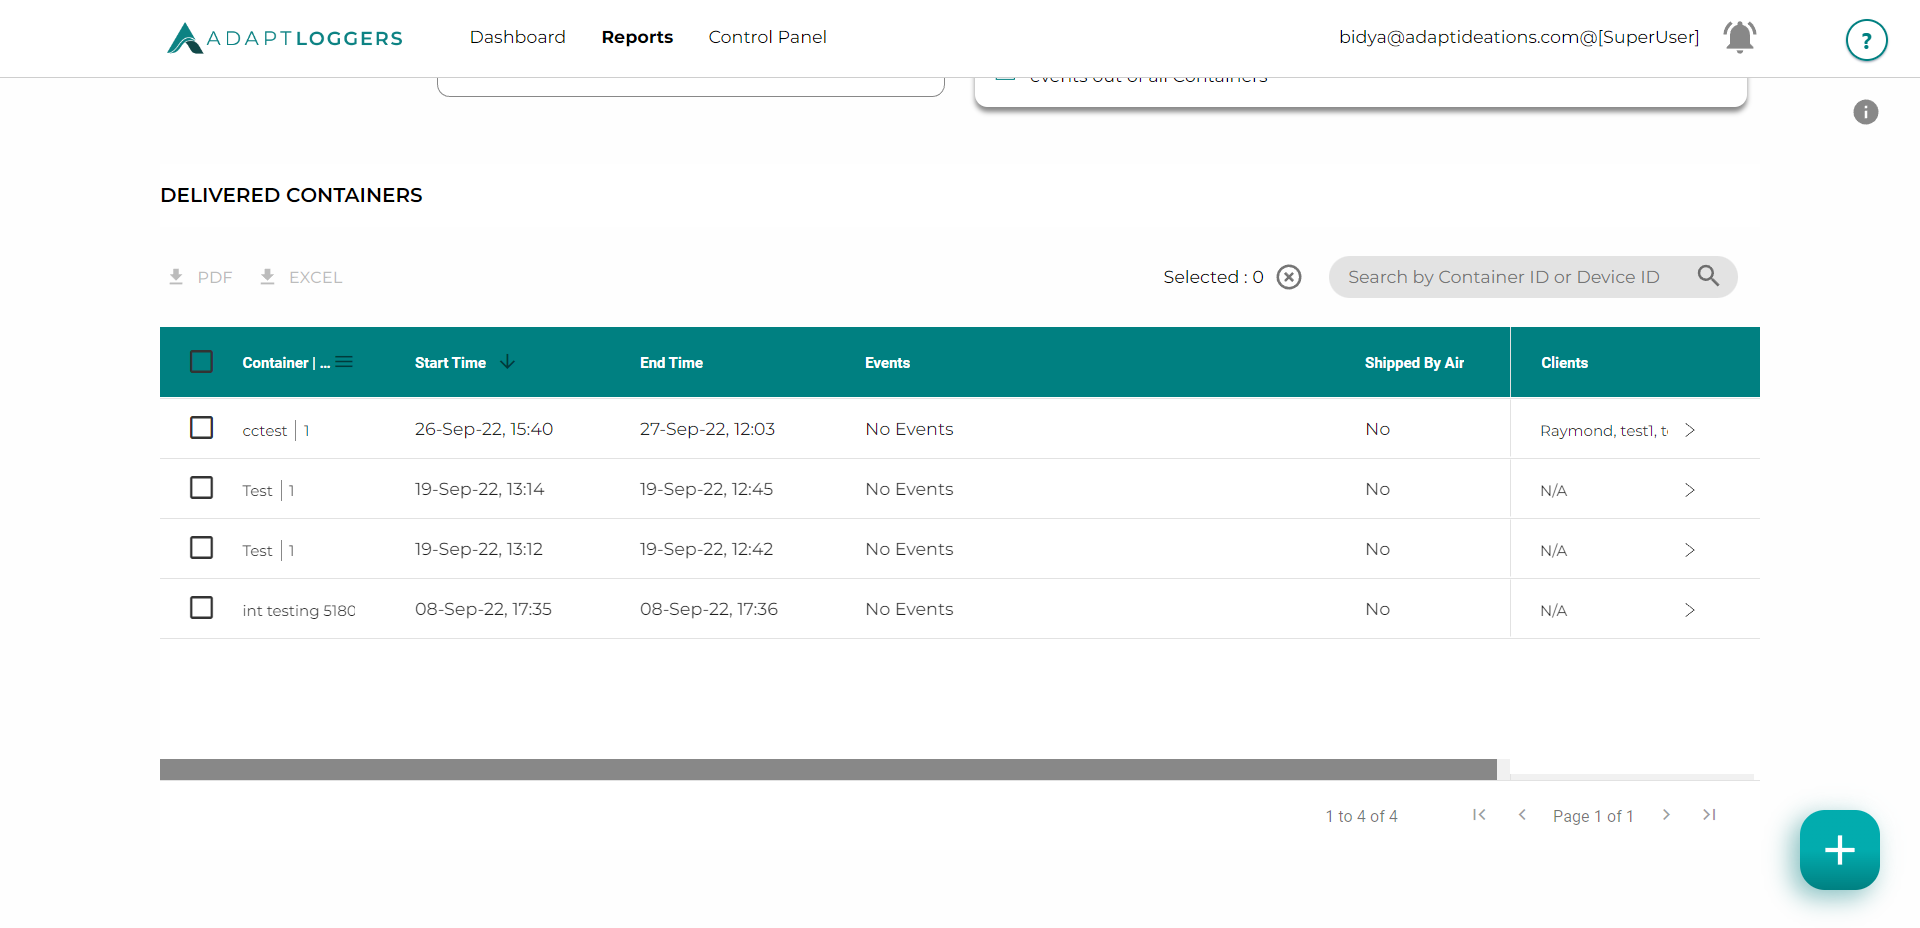
This section displays a list of past consignments and filtered based on the time period set by the user. Each consignment can be further expanded to display device level information and generate device level reports.
To download a PDF report for a consignment, select it from the list and click on the PDF button at the top. A PDF report with consignment details will be downloaded.
Click on the PDF or Excel button provided at the top (see attached below screenshot). A zip folder will be downloaded with individual device reports.
Interim Reports#
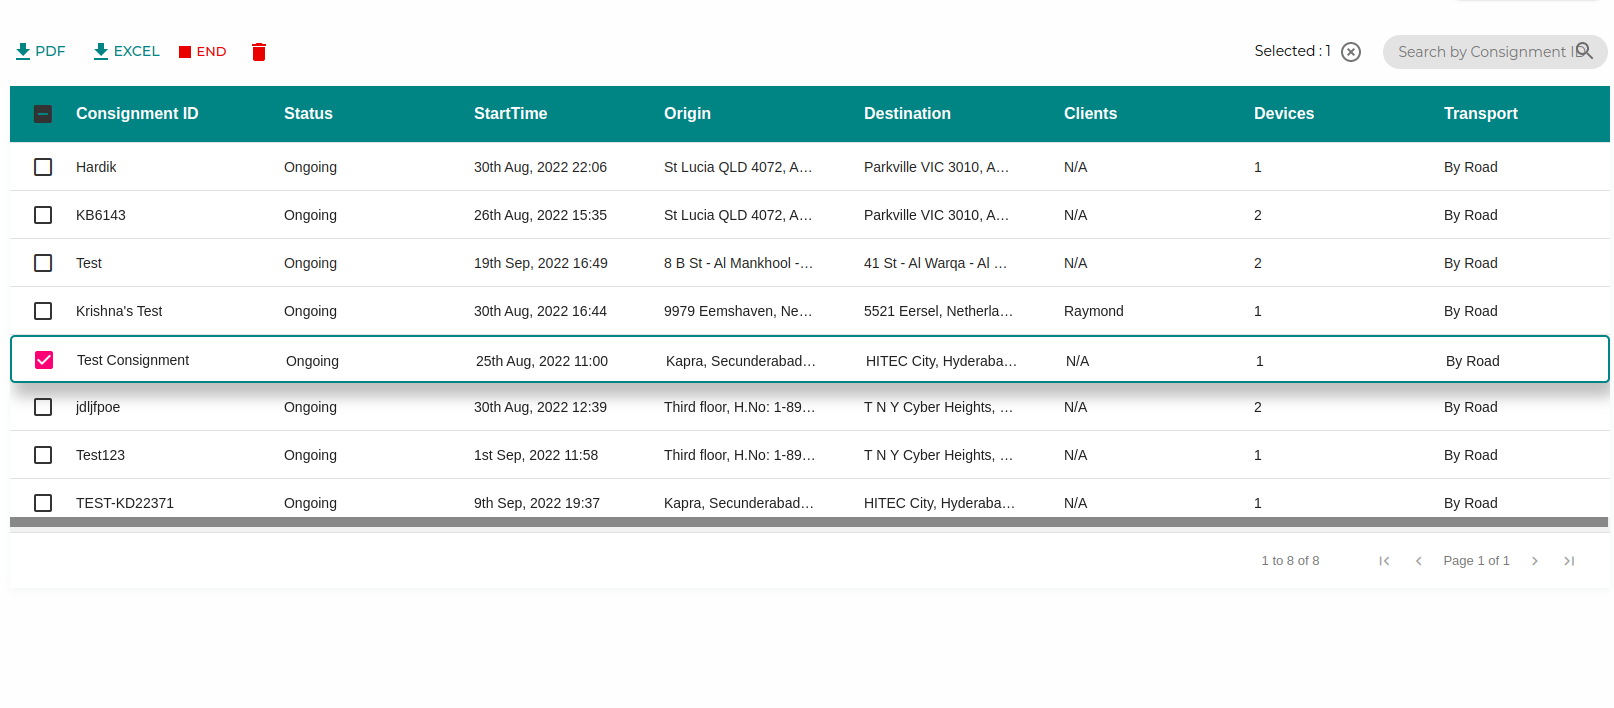
To download the PDF or Excel report of an ongoing consignment, go to Consignments → Select the Ongoing Consignment → Click on the PDF or Excel icon

Device Data#
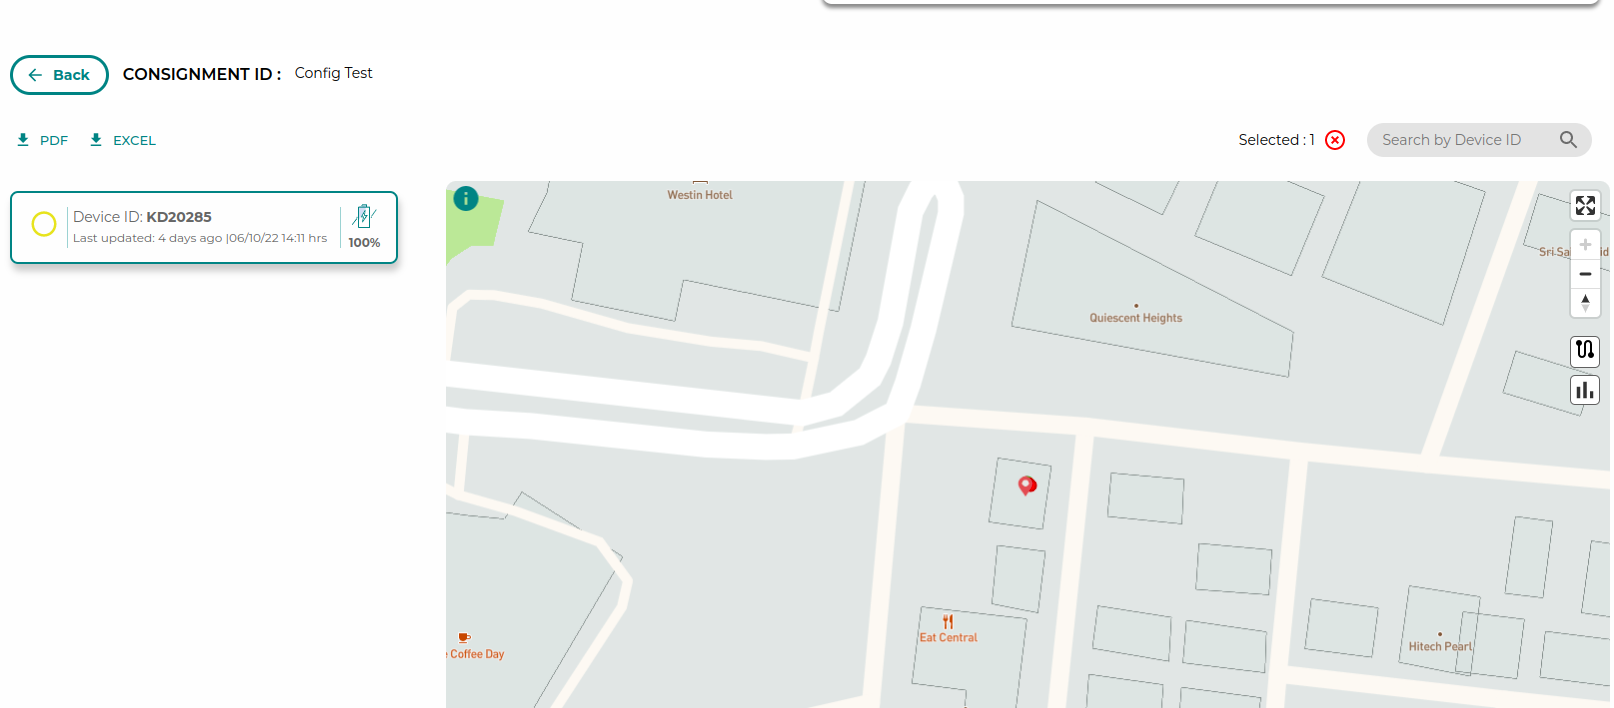
To view device data select a consignment from the list of consignments and click on View Data on the top of the table, or click on the > icon at the end of the row and you can see the devices present in the consignment.

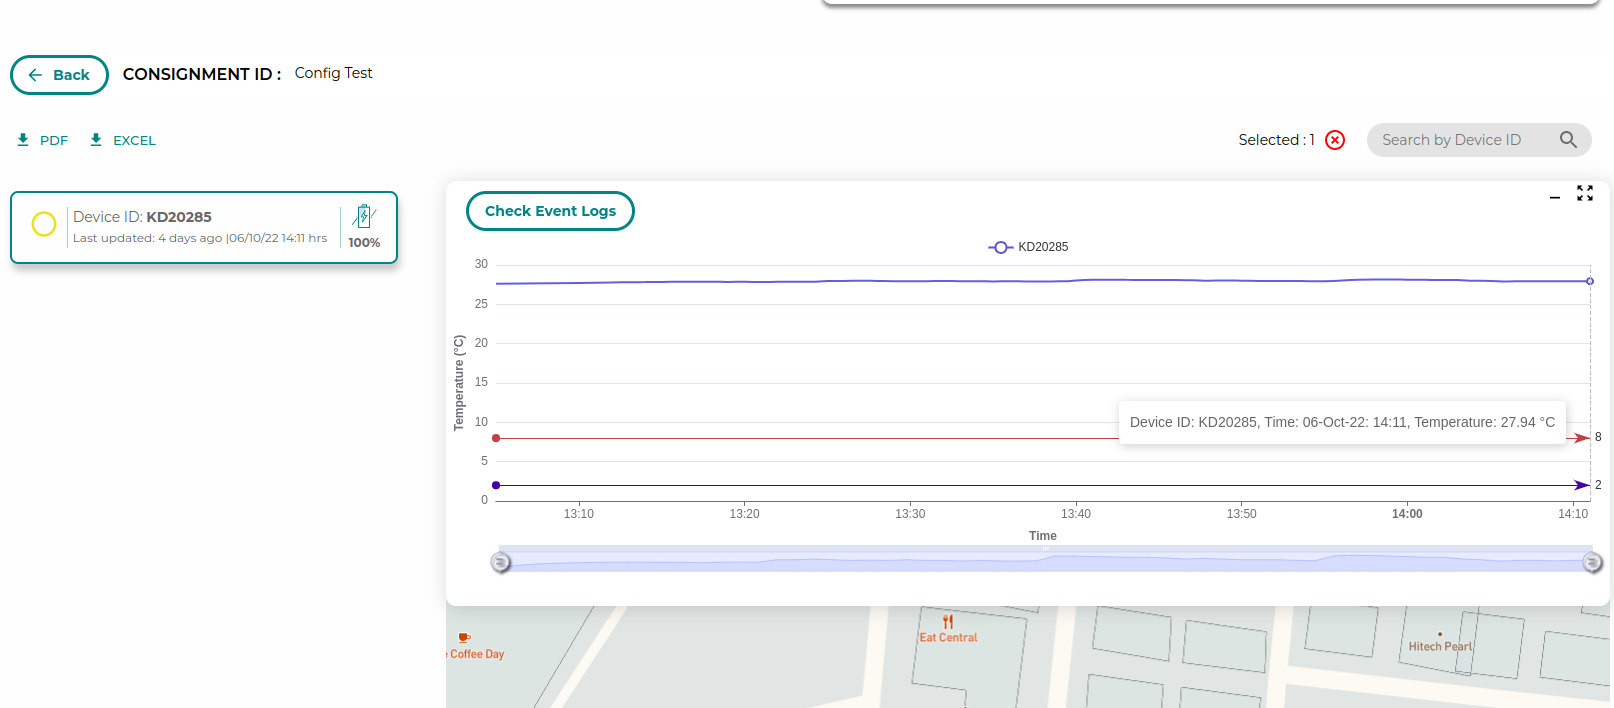
To view temperature data of the device just select the device.

You can minimize the temperature graph by clicking on the minimize icon on the top right corner or expand my clicking on the maximize icon on the top right. Once minimized you can click on the graph icon present on the map, to view the temperature graph again.